
Figure 4.
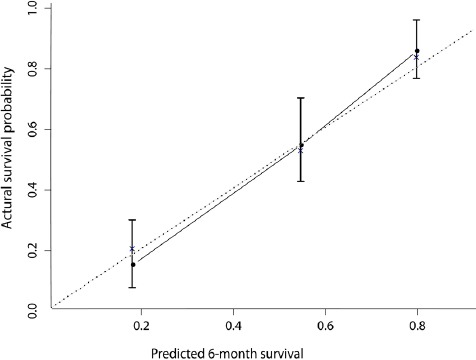
Calibration Plot for Predicting Patient Survival at 6 Months.
The dotted line represents the perfect predicting line, which means that predicted probabilities are identical with the actual probabilities.
Official websites use .gov
A
.gov website belongs to an official
government organization in the United States.
Secure .gov websites use HTTPS
A lock (
) or https:// means you've safely
connected to the .gov website. Share sensitive
information only on official, secure websites.
Calibration Plot for Predicting Patient Survival at 6 Months.
The dotted line represents the perfect predicting line, which means that predicted probabilities are identical with the actual probabilities.