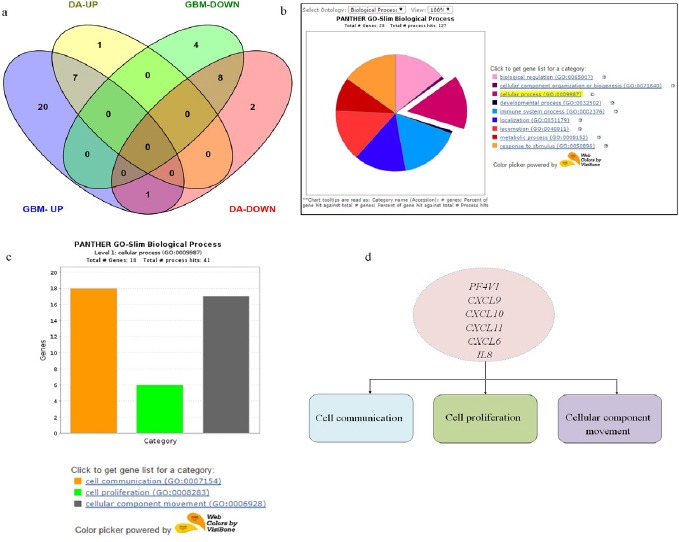
Figure 2.

Gene Expression Summary and Gene Ontology Analysis. a) Venn diagram showing differentially expressed up regulated and down regulated genes between GBM and Diffuse astrocytoma. DA-UP (up regulated genes in Diffused Astrocytoma), GBM-UP (up regulated genes in GBM), DA-DOWN (down regulated genes in Diffused astrocytoma), GBM-DOWN (down regulated genes in GBM). b) Gene Ontology analysis of chemokines and their receptor genes upregulated in GBM-Pie chart of Biological processes associated with 28 chemokines and receptor genes upregulated in GBM. c) Bar graph showing 18 genes involved in three cellular processes-cell communication, cell proliferation and cellular component movement. d) Common genes involved in three cellular processes.
