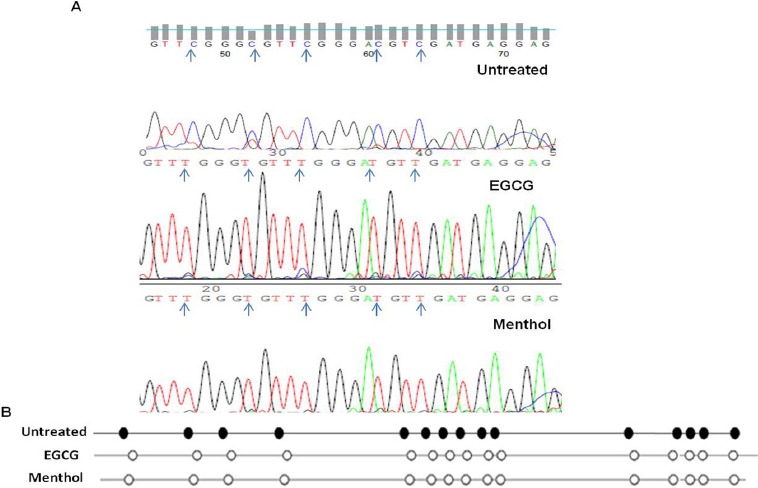
Figure 4.

(A) Reversal of Promoter Hypermethylation in EGCG and Menthol Treated Cells as Compared to Untreated Cells of SiHa Cell Line. Blue arrow Represent “C” in a CpG Dinucleotide (B) Bisulphite Sequencing Analysis of 15 CpG Sites of FANCF Gene Promoter Spanning +280 to +432 Region in Untreated, EGCG and Menthol Treated SiHa Cell Line. Black Dot, Methylated CpG Site; White Dot, Unmethylated CpG Site.
