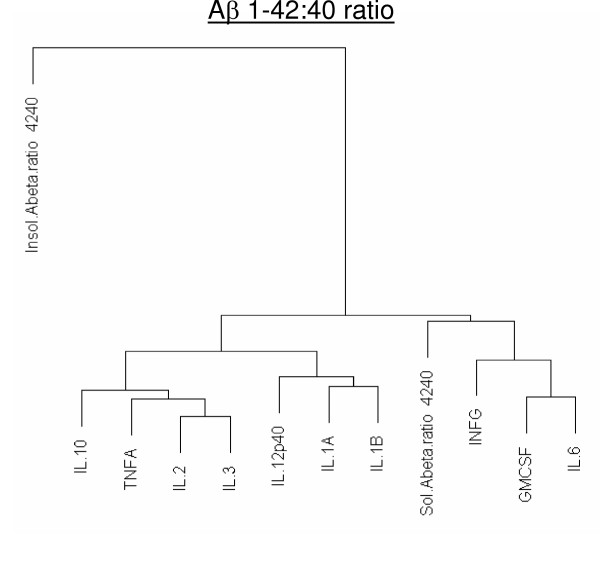
Figure 5.
Dendrogram correlations of (Aβ1–42:40 ratio)-cytokine relationships. Total Aβ1–42:40 ratio's were calculated for both soluble and formic acid extracted Aβ. Closely related members appear under the same node. The farther one needs to travel across the tree to reach another member, the greater the dissimilarity.

