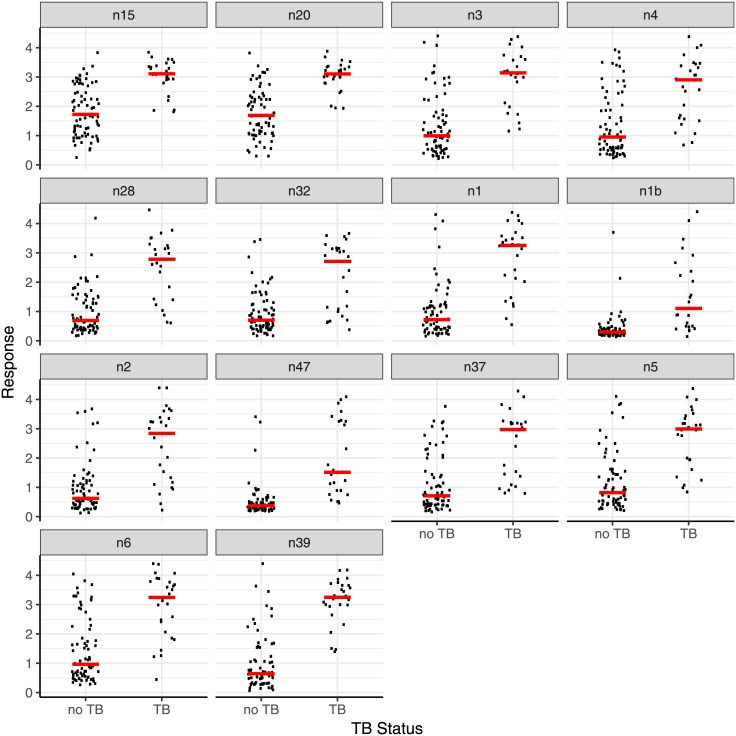
Fig 3. The distribution of responses (absorbances) from the first 100 serum samples from patients with culture positive PTB or culture negative (no TB).
Each method n15—n39 is described in Table 7. The bars indicate the medians. In each case the secondary antibody was peroxidase conjugated and the binding was measured by addition of o-phenylenediamine and H2O2 in citrate buffer and the colour reaction was terminated by the addition of acid. Each individual measurement was carried out in quadruplicate. The bars indicate the medians.

