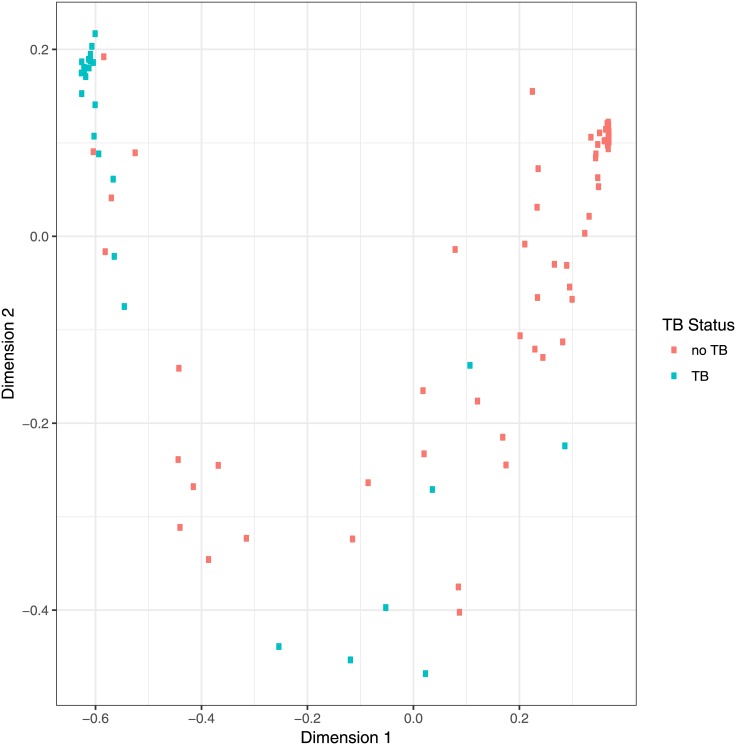
Fig 4. Proximity of individual cases using a Random Forest classifier [63] trained with the absobance for the antigens n15, n20, n3, n28, n32, n1, n39 for the 100 sample data set in R [64].
Proximities were reduced to 2-dimensions using multidimensional scaling. Dimensions 1 and 2 can be interpreted as weighted statistical combinations of the absorbances for each serum sample with the antigens. Abbreviations: as for Fig 3.

