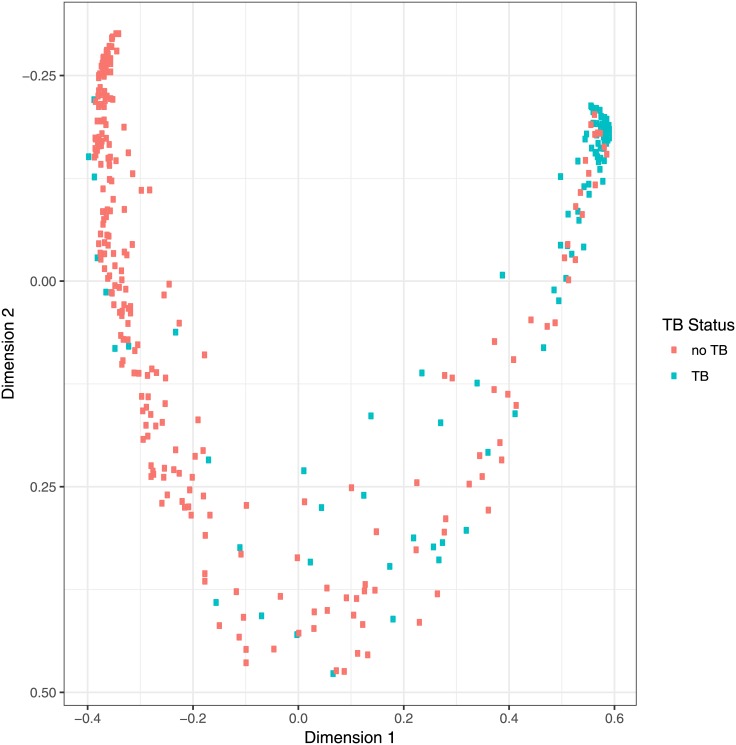
Fig 7. Proximity of individual cases using a Random Forest classifier [59] trained with the absorbances with the 349 serum samples for the antigens n15, n20, n3, n28, n32, n1, n39.
The ROC AUC for this analysis based on the principal co-ordinate (x-axis) compared to PTB or no PTB diagnosis was 0.95. AUC: area under curve.

