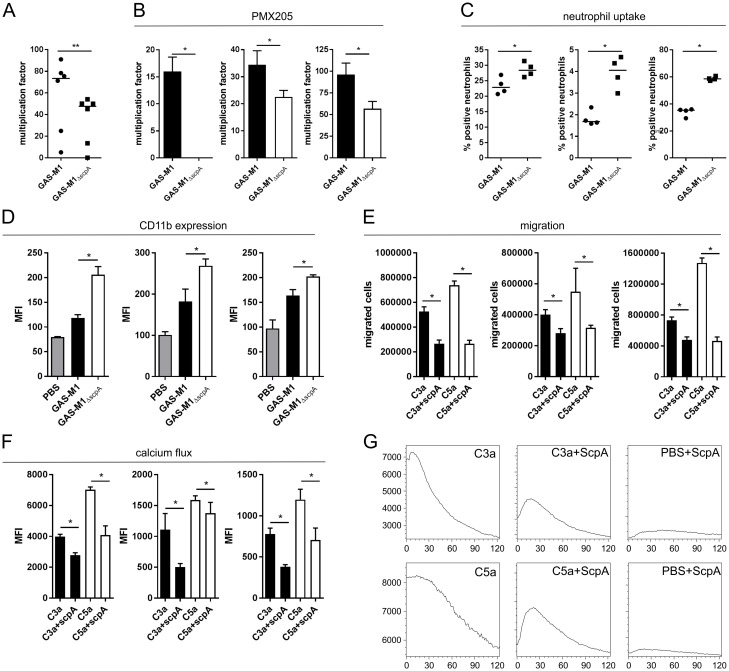
Fig 5. ScpA activity impairs the host neutrophil response to GAS.
A) Survival of GAS-M1 and GAS-M1ΔscpA in whole human blood was quantified by the classical Lancefield assay to determine resistance to neutrophil-mediated killing. Data represent six individual blood donors (each data point is mean of 4 technical replicates), line denotes median value (Mann Whitney U, ** = p<0.001). B) The role of C5a signaling on GAS survival in whole human blood was quantified by Lancefield assay. Whole blood was pre-treated with C5aR1 inhibitor PMX205 (1 μM) [28] prior to incubation with either GAS-M1 or GAS-M1ΔscpA. Each graph represents an independent donor (mean+/- SD 4 technical replicates, Mann Whitney U, * = p<0.05). C) Neutrophil-mediated uptake of fluorescent GAS-M1 and GAS-M1ΔscpA was quantified following incubation with purified human neutrophils. Each graph represents percentage of neutrophils bearing fluorescent GAS from an independent donor (mean+/- SD 4 technical replicates, Mann Whitney U, * = p<0.05). D) Neutrophil activation was assessed by quantification of surface expression of CD11b on purified neutrophils following incubation with GAS-M1 or GAS-M1ΔscpA. Each graph represents an independent neutrophil donor (mean+/- SD 4 technical replicates, Mann Whitney U, * = p<0.05). E) Quantification of neutrophil migration along a chemokine gradient. Absolute number of purified human neutrophils migrating towards C3a or C5a +/- pre-treatment with rScpA was quantified following 30 minute incubation at 37°C. Each graph represents an independent neutrophil donor (4 technical replicates (mean +/- SD), Mann Whitney U, * = p<0.05). F-G) Neutrophil activation by C3a and C5a +/- pre-treatment with rScpA was quantified in a calcium mobilization assay. Calcium transients in fluo-4-AM labelled neutrophils were elicited by C3a or C5a, and calcium derived MFI was recorded on a FACSCalibur from 0–120 seconds. F) Overall MFI of all neutrophils at 120 seconds were compared. Each graph represents an independent neutrophil donor (4 technical replicates (mean +/- SD), Mann Whitney U, * = p<0.05). G) Calcium flux over 120 seconds was visualized following kinetic analysis. Data presented as a histogram of one donor, representative of 3 donors.

