
Figure 6.
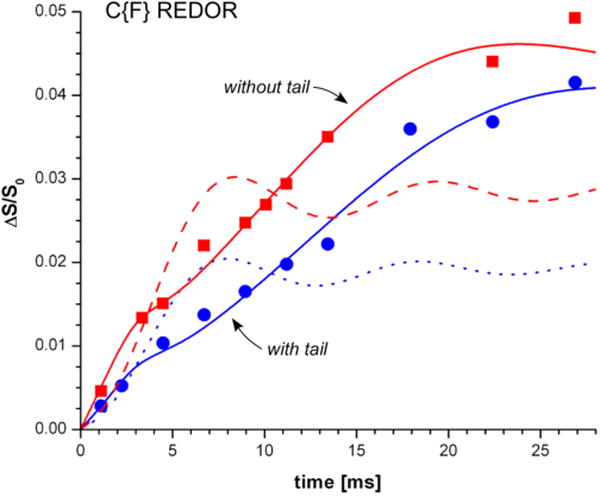
C{F} REDOR dephasing of the 175 ppm carbonyl-carbon peak as a function of dipolar evolution time for double-labeled plusbacin A3 (10 blue symbols) and double-labeled deslipo-plusbacin A3 (10 red symbols) bound to the cell walls of whole cells of S. aureus grown in media containing [1-13C]glycine as a function of dipolar evolution time. The solid lines are the dephasings calculated for a bimodal Gaussian distribution of C–F distances, and the dotted lines, for single distances. (See Figure 7 for values of parameters.) The single-distance calculations can only match a few of the experimental dephasing values.