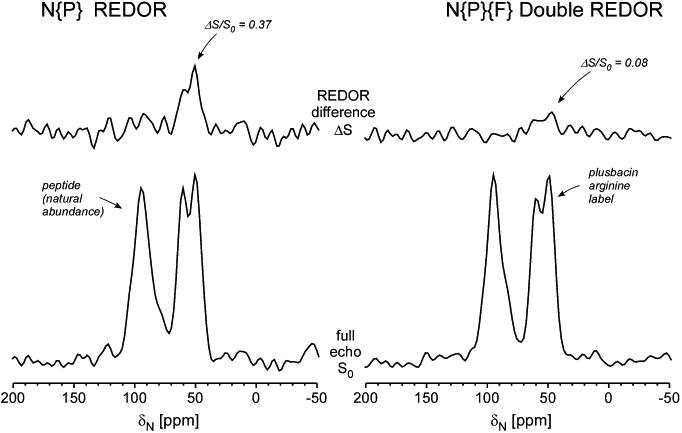
Figure 8.

N{P} REDOR and N{P}{F} double-REDOR spectra of double-labeled plusbacin A3 bound to the cell walls of whole cells of S. aureus after 17.92 ms (left) and 13.44 ms (right) of N–P dipolar evolution using the pulse sequence of Figure 2. The double-REDOR experiment had an additional 4.48 ms of N–F dipolar evolution after a wait of 4 ms. The full-echo spectra are shown at the bottom of the figure and the REDOR differences at the top. The ΔS/S0 of 8% for the N{P}{F} experiment matches the N{F} value for the same N–F dipolar evolution time of Figure 4 (blue).
