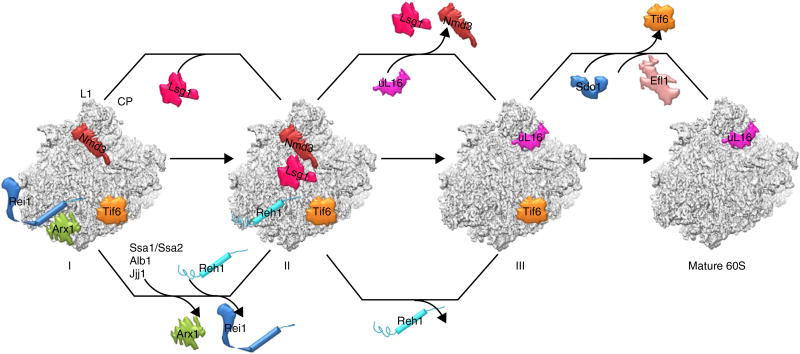
Figure 7.
The model for the final cytoplasmic stages of pre-60S maturation. The map features two parallel pathways for the maturation of two functional centers of the 60S subunit, the PTC-CP region and the tunnel exit region. Three states of pre-60S particles are shown (I, II and III). State I represents a stage following the release of Nog1/Rlp24 and the binding of Rei1. State II is the one reported in the present work.

