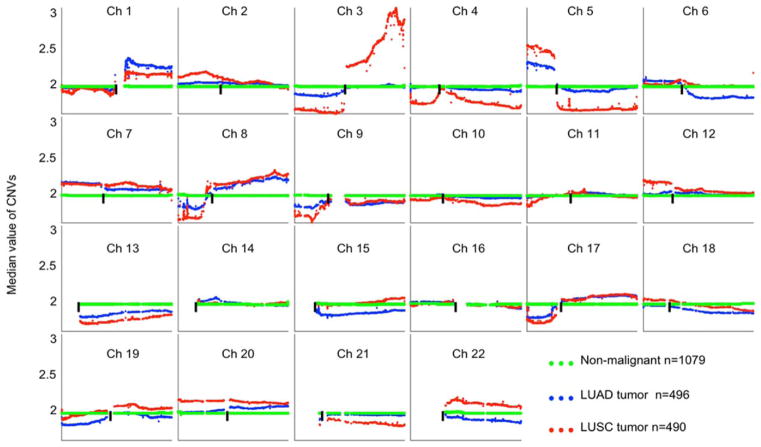
FIGURE 1.
Comparison of CNV patterns between LUAD and LUSC tumors for each chromosome, TCGA only. Each spot is the median value of copy numbers of each gene in the corresponding group. The genes are sorted according to their locations. The space between two arms of each chromosome is the location of the corresponding centromere. [Color figure can be viewed at wileyonlinelibrary.com]

