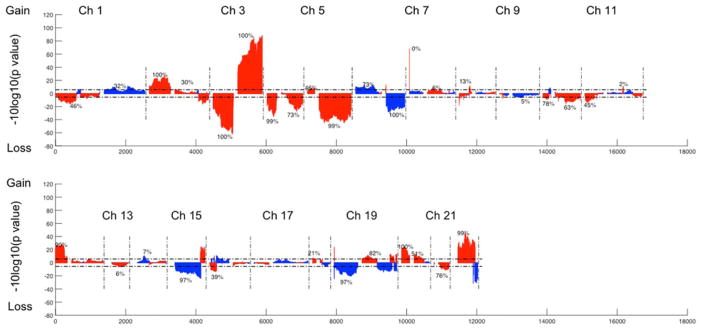
FIGURE 2.
Genome-wide CNVs t-test between LUAD and LUSC tumor samples in the TCGA dataset. Blue color indicates that the deflection (tumor vs. non-malignant samples) was greater for LUAD, whereas red color indicates that the deflection was greater for LUSC. The dashed horizontal lines are the cutoff lines according to the Bonferonni correction (2.1 × 10⁻⁶). The vertical dashed lines separate the data of each chromosome. A gap within the individual chromosome data indicates the location of the centrosome. For chromosomes 13, 14, 15, 21, and 22 only genes on the q arm were represented on the microarray. [Color figure can be viewed at wileyonlinelibrary.com]

