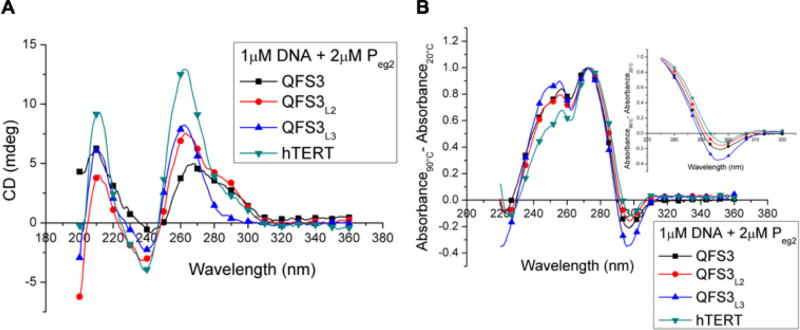
Figure 2.
Peg2 forms DNA/PNA heteroquadruplexes with long loop-containing DNA G-quadruplexes. (A) CD spectra of each Peg2/DNA complex in 100 mM K+ suggests overall more parallel topology (min at 240 nm, max at 260 nm) than those of the DNA alone (Figure 1A). (B) TD spectroscopy in 100 mM K+ detects G-quadruplex formation for each complex as evidenced by the inversion near 295 nm. The inset graph highlights the region around 295 nm.

