
Figure 1. Machine Learning Classification.
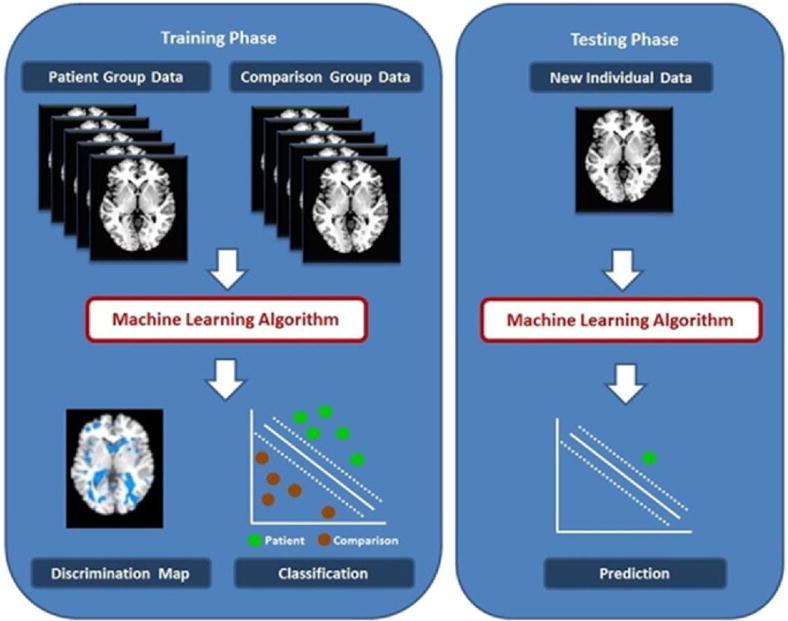
This is a simplified illustration of the Gaussian Process Classifier functions that outlines the general principles of multivariate machine learning classification as applied to neuroimaging data from two hypothetical groups, referred to as patient and comparison group. During the training phase (left panel), the classifier is separately presented with multiple neuroimaging datasets of individuals that belong to one or the other group. The algorithm uses these data to assign a predictive weight to each voxel as more or less likely to be associated with one or the other group. The output of the classifier is a discrimination maps showing regions that have the most significant contribution to classification (left panel, bottom left) and values regarding the performance of the classifier based on their separating hyperplane (left panel, bottom right). During the test phase, a previously unseen dataset is presented to the algorithm and is classified based on its probability of belonging to either the patient or comparison group.