
Figure 2. Unthresholded discrimination maps for the classifier based on the 3-back >0-back contrast.
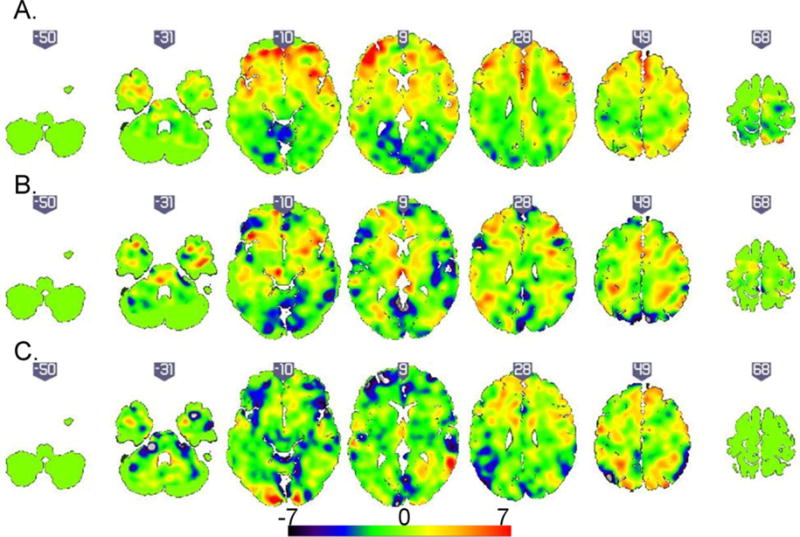
(A). Patients with Bipolar Disorder (BD) versus unrelated healthy individuals. In the corresponding discrimination map, positive coefficients (red) indicate clusters with predictive value for BD (B). Patients with BD versus relatives with Major Depressive Disorder. In the corresponding discrimination map, positive coefficients (red) indicate clusters with predictive value for BD (C). Patients with BD versus healthy relatives. In the corresponding discrimination map, positive coefficients (red) indicate clusters with predictive value for psychiatrically healthy relatives.