
Figure 2. CAG repeat-containing RNAs coalesce into liquid-like nuclear foci.
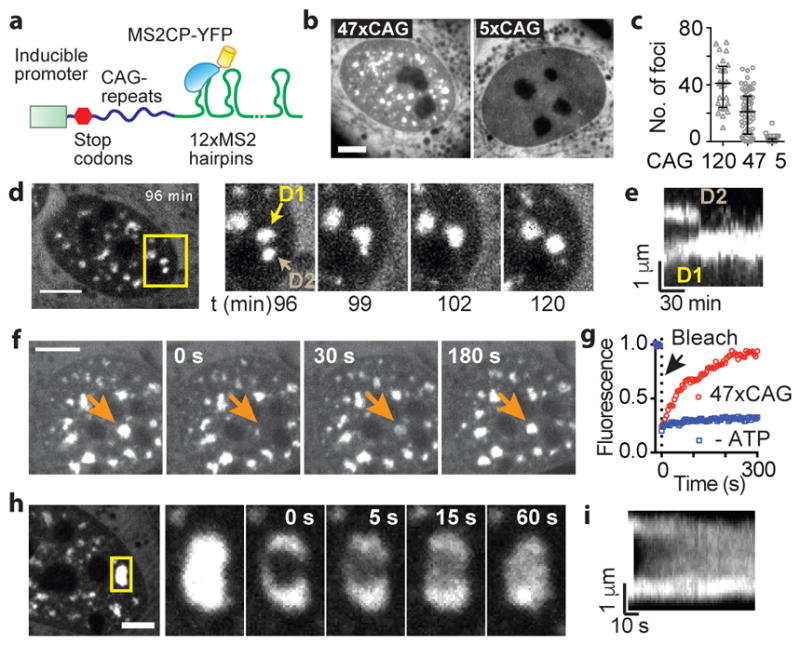
(a) Schematic for RNA visualization. (b) Micrographs of cells expressing 5xCAG or 47xCAG RNA. (c) Quantification of foci as a function of CAG repeat number. Each datum point represents one cell. Error bars, median and interquartile range. (d) Typical fusion event between RNA foci (time post induction indicated). (e) Kymograph corresponding to (d). (f) Images for 47xCAG RNA foci before and after photobleaching (arrow: bleach site). (g). FRAP trajectories for 47xCAG RNA punctum before (47xCAG) and after ATP depletion (−ATP). (h) Similar to (g) after partial photobleaching. (i) Kymograph corresponding to (h). Scale bars, 5 μm. Data are representative of ≥ 3 independent experiments.