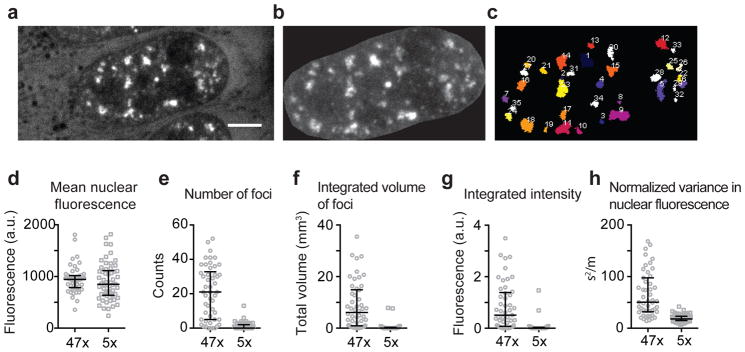
Extended Data Figure 4. Identification of RNA foci in live cells.
(a–c). We used a fluorescence intensity and size based threshold to identify RNA foci. Briefly, U-2OS cells expressing the RNA of interest together with MS2CP-YFP were imaged using a spinning disk confocal microscope, and 0.3 μm Z-stacks were acquired (a). To account for variability in MS2CP-YFP expression levels, we used a cell-intrinsic intensity threshold for foci identification. We manually segmented the nuclei (b), and determined the mean fluorescence intensity in the nucleus. RNA foci were identified using FIJI 3D Objects Counter plugin, with an intensity threshold as 1.6x the mean fluorescence intensity in the nucleus of the cell, and a size cut-off of >50 adjoining pixels (pixel size, 83 nm x 83 nm). This algorithm faithfully identified the foci as depicted in (c). (d–h) We compared the extent of foci formation in 47xCAG and 5xCAG expressing cells. (d) The mean nuclear fluorescence intensity is similar between the 47xCAG and 5xCAG expressing cells. The cells are compared via various metrics: (e) number of foci per cell, (f) total volume of foci per cell, (g) integrated fluorescence intensity of the foci per cell and, (h) normalized variance in the fluorescence intensity in the nucleus per cell. Scale bar represents 5 μm. Error bars depict median and interquartile range.

