FIGURE 1:
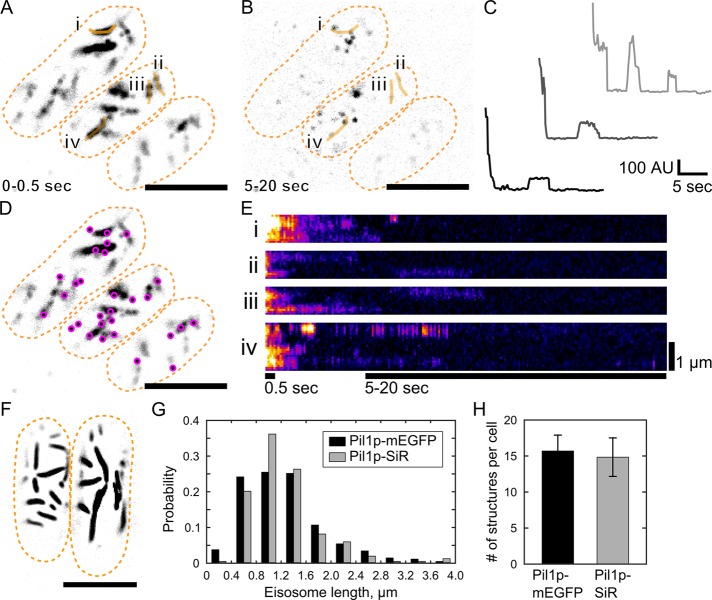
Single-molecule recovery after photobleaching of SNAP-tag labeled Pil1p. Cells expressing Pil1p-SNAP were labeled with SNAP-SiR647 at 0.5 µM for 15 h, washed, and imaged in TIRF. (A) Average intensity projection of the first 5 frames (0.5 s) of a movie reveals linear eisosomes. (B) Maximum intensity projection of frames 50–200 (5–20 s) of the same movie shows single-molecule recovery events. Orange lines i–iv are the line traces used for the kymographs in E. (C) Example intensity traces of SRAP spots show stepwise photobleaching and single-molecule recovery of Pil1p-SiR. (D) The positions of single-molecule recovery events (SRAP spots, magenta) are mapped on the visible eisosomes. (E) Kymographs of line traces along eisosomes (i–iv as labeled in A and B), with bars indicating the time spans for the projection images. (F) Cells expressing Pil1p-mEGFP imaged in TIRF are similar in appearance to SNAP-tag–labeled cells in A. (G) Comparison of eisosome lengths measured in cells with Pil1p-mEGFP (black, 1250 ± 650 nm for 304 eisosomes) or labeled Pil1p-SiR (gray, 1240 ± 580 nm for 275 eisosomes) show no significant difference by two-sample Kolmogorov–Smirnov test (p = 0.33). (H) Comparison of number of eisosome objects visible in cells expressing Pil1p-mEGFP (black, 15.7 ± 2.2) or labeled Pil1p-SiR (gray, 14.8 ± 2.7) shows no significant difference by two-sample Kolmogorov–Smirnov test (p = 0.89). Scale bar, 5 µm (A, B, D, F). Cell outlines are drawn in orange dashed lines. Mean ± SD reported for at least 16 cells in each measurement.

