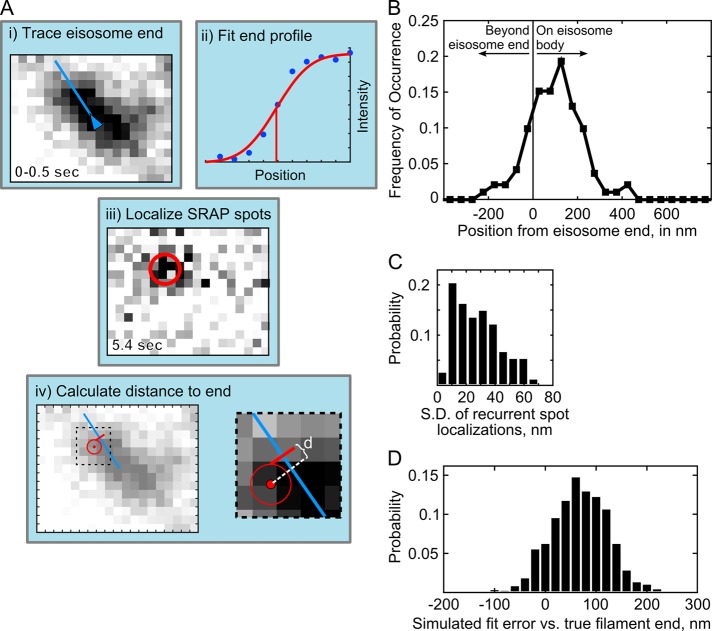
FIGURE 2:
Image analysis for localization of SRAP spots at eisosomes. (A) Schematic of the measurement of distance to eisosome end. (i) The end of an eisosome is traced in the average projection of the first 5 frames (0–0.5 s); (ii) the line intensity profile at the eisosome end is fitted to determine the position of the diffraction-limited end (red line); (iii) a SRAP spot position is determined with the PeakFit plug-in for ImageJ in the movie frame when it appeared, and superresolution localizations from multiple frames are averaged to calculate the position of the SRAP event; (iv) the distance, d, is calculated from the SRAP spot along the eisosome line trace to the end; in i, iii, and iv, one image pixel is 70 nm. (B) Measured SRAP spot positions relative to the eisosome end, average 97 ± 119 nm SD (191 spot/filament pairs across 20 cells). (C) Spot localization precision is determined as SD calculated for each SRAP spot that included multiple localizations in time, average 27.9 ± 15.9 nm SD (73 sets). (D) Errors in fitting of simulated sparsely labeled, dynamic eisosome ends. Mock eisosome end intensity profiles (as in Aii) were generated according to a 3% labeling efficiency, with three extra emitters added to the end position and fitted as described in Materials and Methods. Average difference between fitted end position and simulated true end is 67.8 ± 56 nm SD (1000 simulations).

