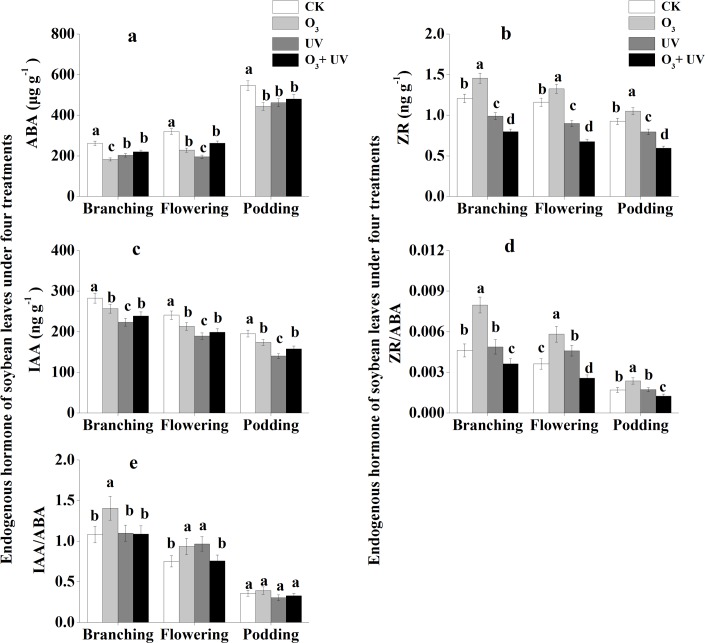
Fig 3. Endogenous hormones of soybean leaves under elevated O3 and UV radiation at branching, flowering and podding stages.
Data are means ± SE, with n = 3 for each treatment. Different letters above the bars represent significant differences from Tukey’s multiple comparisons among four treatments (P<0.05).

