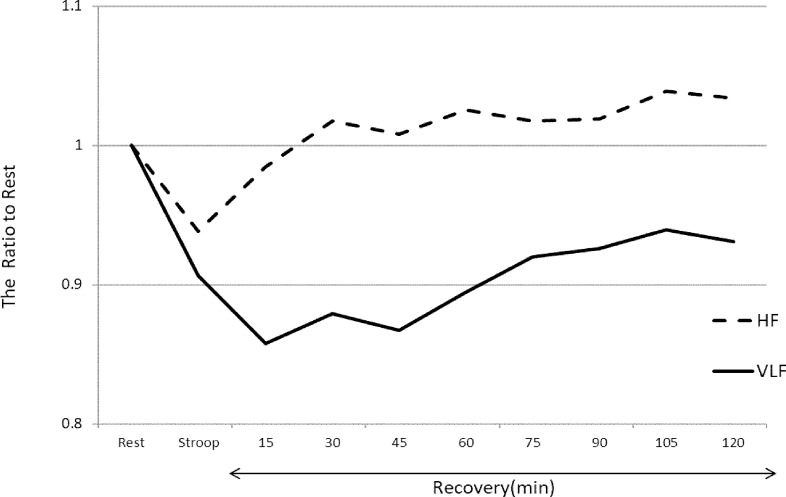
Fig 1. Ratio of Stroop and recovery to rest for HF and VLF components.
HF = high frequency; VLF = very low frequency. This graph shows the HF and VLF component changes during the Stroop color word task and recovery after the task. The graph shows the ratio of Stroop and recovery to rest times. The solid line shows the VLF component of HRV, and the dashed line shows HF. During the Stroop color word task, both the HF and VLF components decreased from that during rest. In the recovery time, the HF component recovered to baseline a few minutes after the Stroop color word task; however, the VLF component remained decreased for 2 h after the task.

