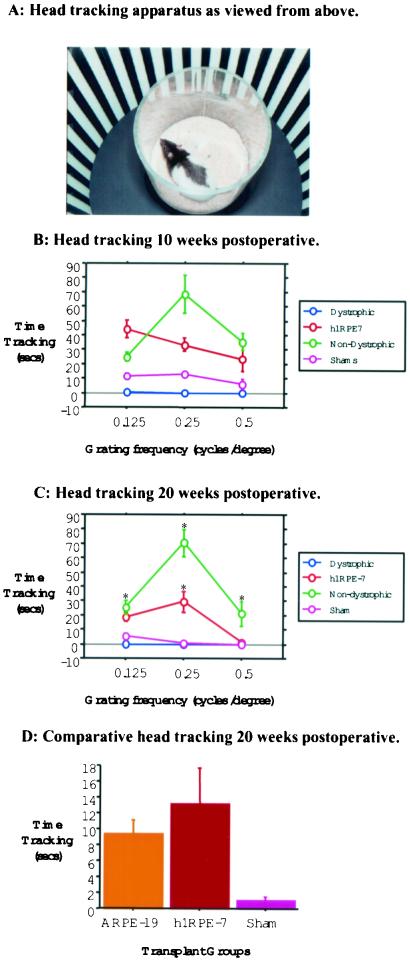
Figure 2.
Head-tracking to high contrast square-wave gratings. (A) Photograph of head-tracking apparatus showing RCS rat in holding chamber and rotating drum lined with square-wave grating. (B) Total amount of time h1RPE7-grafted animals spent tracking a moving square-wave grating in seconds over a period of 4 min after 10 weeks posttransplant. (C) Head-tracking 20 weeks after h1RPE7 transplantation. Error bars represent SEM. *, P < 0.05, represents statistical difference in nondystrophic h1RPE7-grafted animals as compared to sham and dystrophic groups. (D) Comparative analysis of mean tracking over all frequencies for ARPE19, h1RPE7, and sham showed a significant difference (F = 7.05; df = 2, 23; P < 0.01 Student–Neuman–Keuls post hoc analysis) between sham and both transplant groups but no significant difference between transplant groups.

