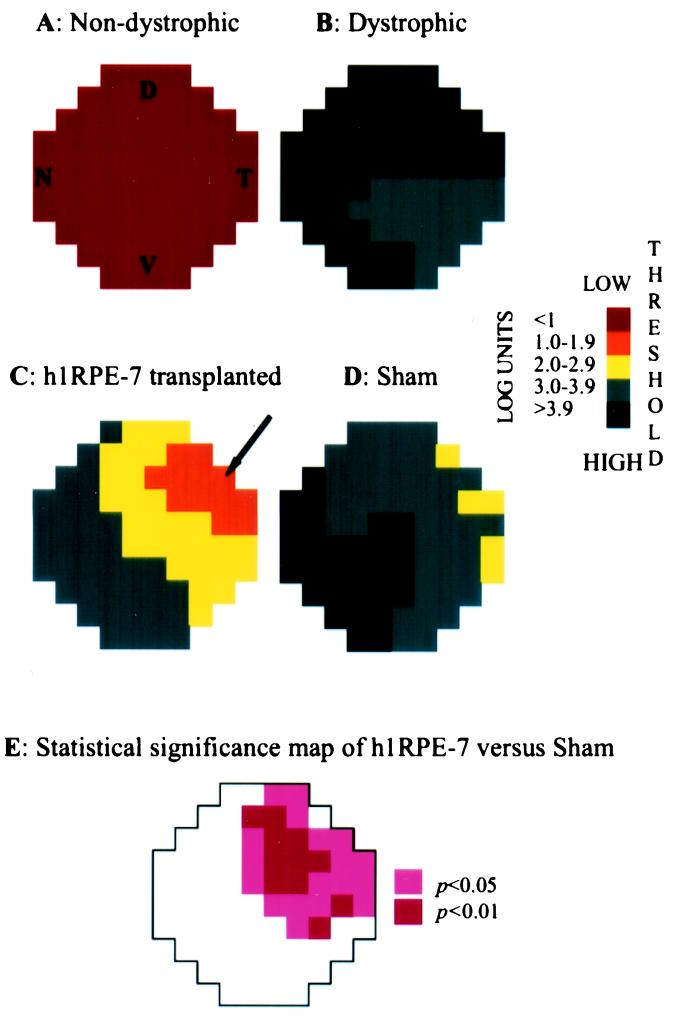
Figure 3.
Threshold light-sensitivity maps of congenic, dystrophic, h1RPE7-transplanted, and sham-operated RCS rats. RCS rats were divided into four groups: (A) normal (3 nondystrophic rats); (B) no treatment (6 dystrophic rats); (C) h1RPE7 cells injected into one eye (5 dystrophic rats); and (D) sham-injected (5 dystrophic rats). Schematic representation of a dorsal view of the superior colliculus showing respective thresholds for 76 individual recording sites (color-coded squares). A log scale of thresholds measured in cd/m2 is shown. Each point shows the mean response for that position in the 3–6 animals used in each experimental group. Variance was calculated at each point, allowing statistical evaluation of differences between groups. To test efficacy of h1RPE7 grafts vs. sham-injected animals, significance was determined at each of the 76 points by using a randomization test (see Materials and Methods). An area of significantly preserved visual function was recorded for the h1RPE7-transplanted animals as shown in E. The letters D (dorsal), V (ventral), N (nasal), and T (temporal) indicate the corresponding topological representation of the retina onto the superior colliculus, and all figures retain the same orientation. The arrow represents the grafted quadrant.

