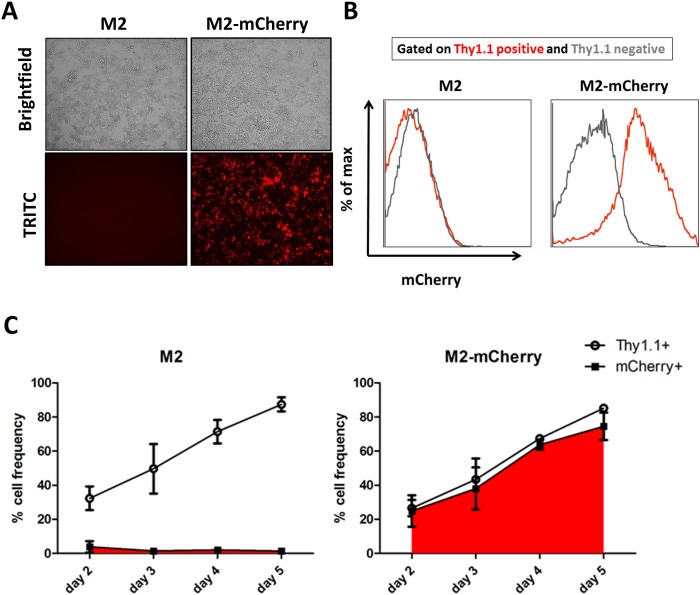
Fig 2. Detection of M2 reporter activity in activated splenic B cells.
(A) Representative images of transduced primary B cells obtained from brightfield and TRITC filters at day 3 post-transduction. (B) Representative flow cytometry histograms obtained at day 3 post-transduction compare mCherry expression in Thy1.1 positive (red) and Thy1.1 negative (grey) populations as determined by FACS analysis. (C) Frequencies of cell surface Thy1.1 and intracellular mCherry expression of M2-transduced (left panel) and M2-mCherry-transduced (right panel) B cell cultures were monitored over the time course by flow cytometry. Mean and standard deviation values were derived from compiling data from two independent experiments containing three replicates per condition per time point.

