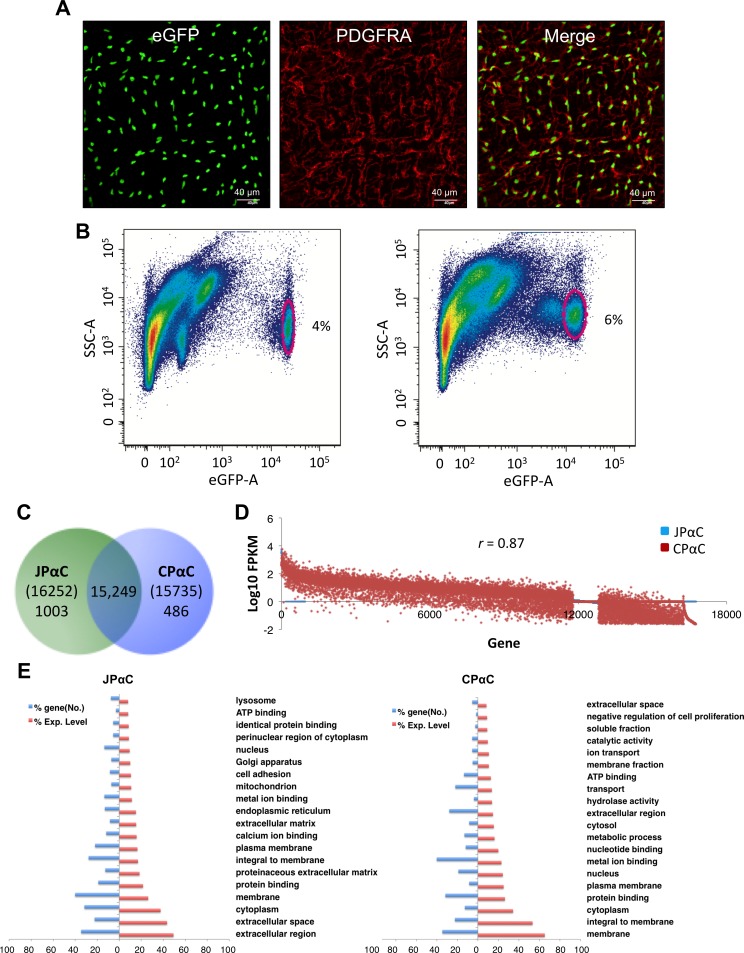
Fig 1. Anaysis of transcriptomes obtained from jejunal and colonic PDGFRα+ cells.
(A) Identification of PDGFRα+ cells in the intestinal smooth muscle with eGFP and a PDGFRA antibody. A z-stack image, obtained through confocal microscopy, of whole-mount jejunum muscularis showing PDGFRα+ cells expressing eGFP in the nucleus (left). Immunohistochemistry of PDGFRα+ cells using a PDGFRA antibody (middle). Merged images of eGFP and PDGFRA (right). (B) Primary eGFP+ PDGFRα+ cells from jejunum (left) and colon (right) identified (circled) by flow cytometry. (C) Venn diagram showing the number of genes identifed in jejunal and colonic PDGFRα+ cells (JPαC anc CPαC) by RNA-seq. (D) Comparison of expression levels of genes in JPαC and CPαC. (E) Gene ontologies reported in JPαC and CPαC. The gene ontology (GO: function, process, and component) of PαC-specific genes was analyzed, and key GO terms were compared using normalized expression (FPKM) percentile.

