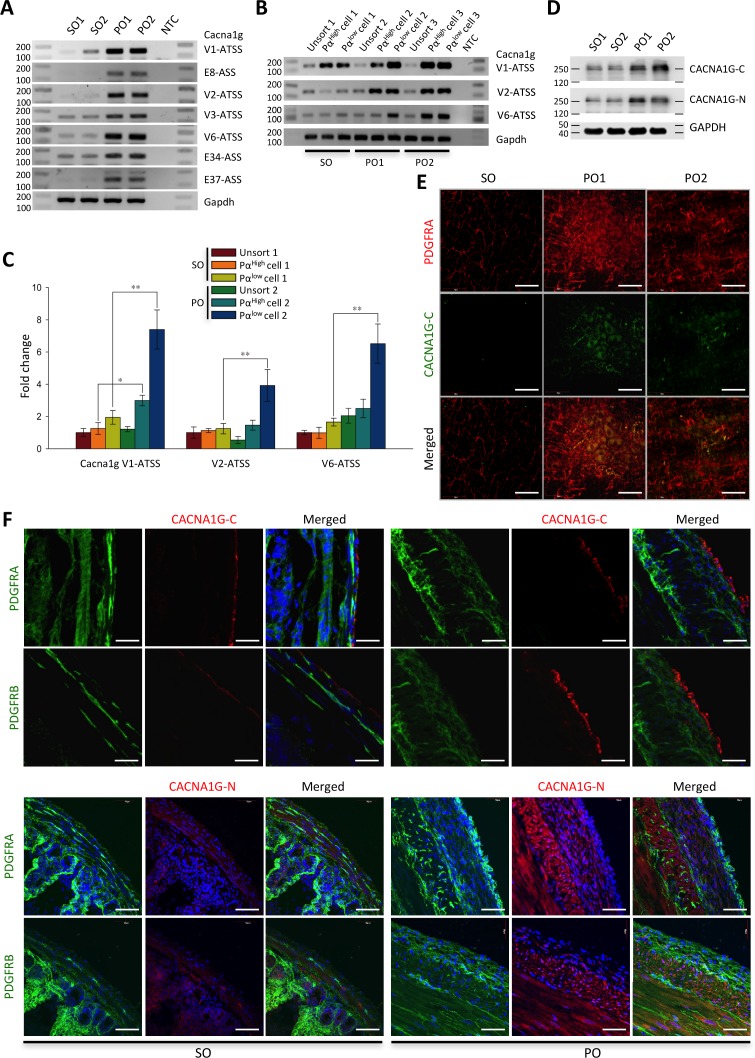
Fig 6. Induced expression of Cacna1g mRNAs and protein in hypertrophic smooth muscle.
(A) Expression of Cacna1g exons with alternative transcriptional start sites (ATSS) and/or alternative spliced sites (ASS) in sham operation (SO) and partial obstruction (PO) examined by RT-PCR. NTC is non-template control. (B) Detection of Cacna1g mRNAs in isolated eGFPhigh and eGFPlow PDGFRα+ cells from sham operation and partial obstruction opertaion by RT-PCR. PCR products were analyzed with a DNA size marker on 1.5% agarose gels. Note expression of Cacna1g is increased in eGFPhigh and eGFPlow PDGFRα+ cells. (C) Quantification of Cacna1g mRNAs by qPCR. * p ≤ 0.05 and ** p ≤ 0.01, SO versus PO. (D) Western blot analysis using N-terminal and C-terminal CACNA1G antibodies (CACNA1G-N and CACNA1G-C), showing that the protein has significantly higher expression levels in hypertrophic tissue induced by partial obstruction. (E) Detection of serosal PDGFRα+ cells expressing CACNA1G in partial obstruction models by CACNA1G-C antibody. Scale bars are 50 μm (F) Confocal cross section images of serosal PDGFRα+ cells in sham operation and partial obstruction screened with CACNA1G-N and CACNA1G-C antibodies co-labeled with PDGFRA and PDGFRB antibodies. Scale bars are 50 μm.

