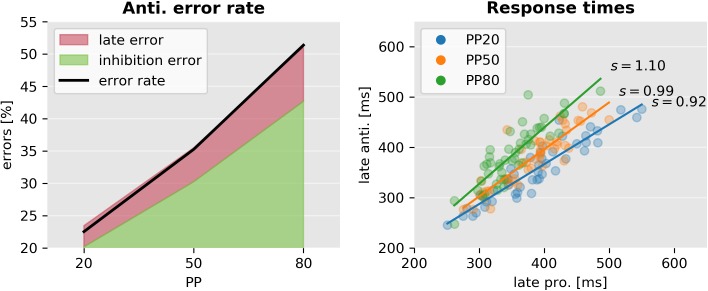
Fig 15. Error sources and the correlation of response times.
Left: Error rate (black line) split into the two causes predicted by the model. Inhibition errors are early actions that always trigger prosaccades. Similarly as described by [23], late errors occur when a late response leads to a prosaccade. Right: Correlation between correct antisaccades' and late prosaccades' response times according to the best SERIAlc model. The best linear fit is depicted as a solid line. The mean ratio of pro- and antisaccade response times (s) is displayed on the right. Although late pro- and antisaccade response times are highly correlated, their ratio is different in each condition (interaction PP and late prosaccade response time F = 9.2, p < 0.001).

