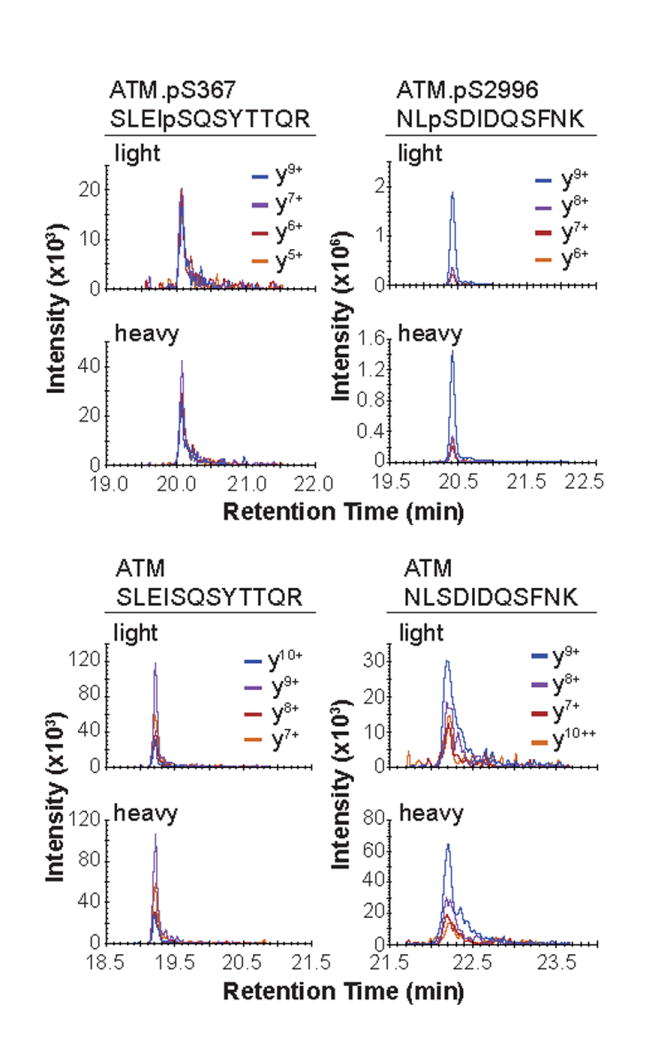
Figure 1. Chromatograms for targeted ATM peptides.

Chromatgorams for the phosphorylated (top panel) and non-modified analogs (bottom panel) for the targeted peptides as measured by MRM and analyzed from 500 μg total protein of the Process QC standard sample described in the method.
