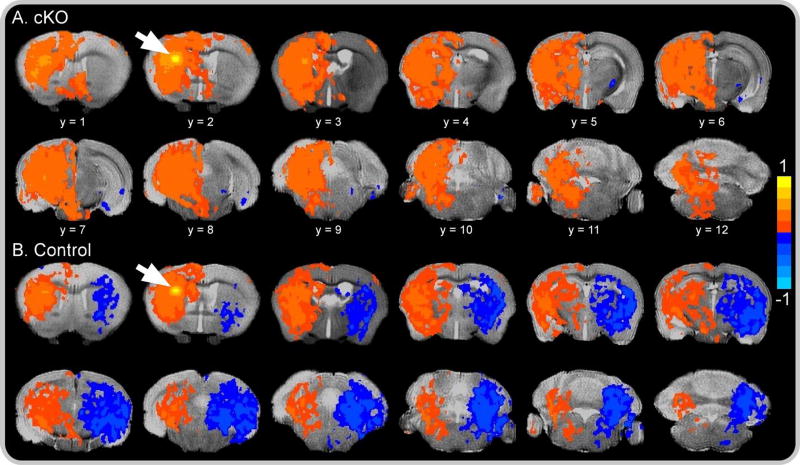
Figure 3. Resting-state functional connectivity color map.
Spatial color coded z-maps for (A) cKO and (B) control mice of functional connectivity networks across all 12 brain slices originating from a single seed location (white arrow) in the left dorsolateral striatum. Positive values, represented by warm (red) colors, denote a significant increase in network-level functional connectivity with the seed location, whereas negative values, represented by cold (blue) colors, denote a significant decrease in functional connectivity with the seed location. Results are voxel level thresholded at P < .005 and FWER corrected at P < .05. Color maps are superimposed over the T2-weighted image of a single subject.

