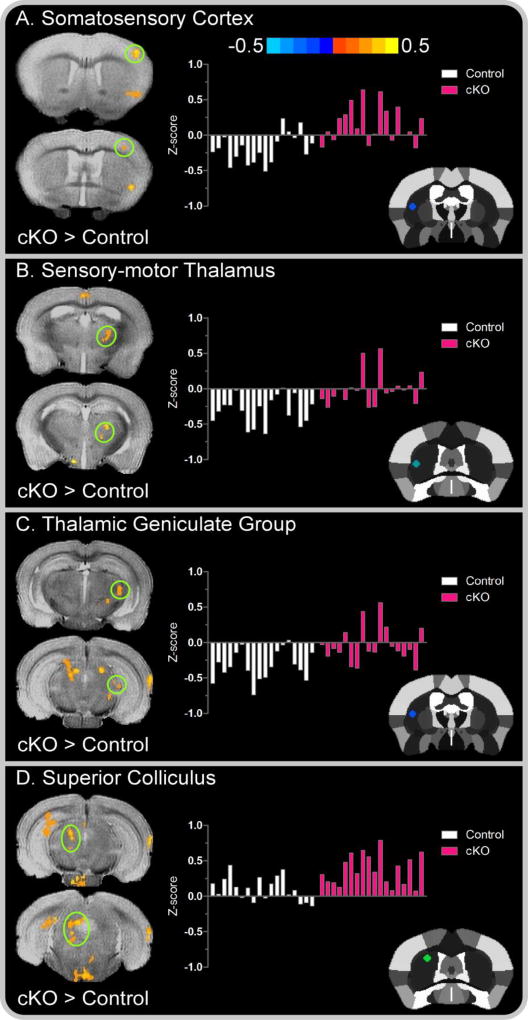
Figure 4. Left seed cortical and subcortical between-group functional connectivity color maps.
Color bar represents the mean difference in z-score values for cKO versus control mice. Cluster results are voxel level thresholded at P < .005 and FWER corrected at P < .05. Positive values, represented by warm (red) colors denote a significant increase in functional connectivity for cKO mice in the (A) primary somatosensory cortex; (B) sensory-motor thalamus (C) thalamic geniculate group and (D) superior colliculus. Functional connectivity clusters are superimposed over the T2-weighted image of a single subject. The offset right bar plot in each panel depicts the subject-by-subject mean z-score values for the associated cluster in controls (white bars) and cKO mice (pink bars). The stereotaxic template atlas (Ferris et al. 2014) in each panel depicts the seed location within the left striatum wherein connectivity clusters originated.

