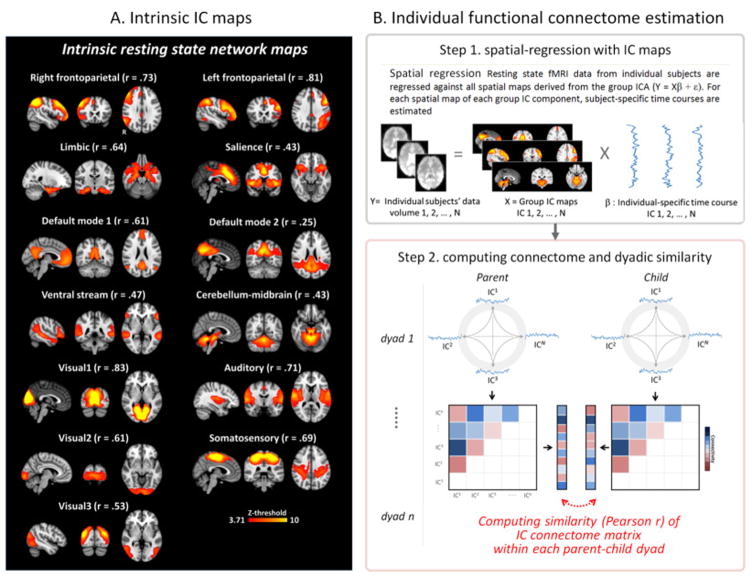
Figure 1.
(A) Group-level intrinsic resting state network (RSN) maps used in the current analysis. These 13 network maps were identified and adopted from a paper published previously on the larger sample in which the current participant sample was included(Lee and Telzer, 2016). Each “r” indicates spatially cross-correlation coefficient value with canonical RSN templates acquired from previous studies (Laird et al., 2011; Shirer et al., 2012; Smith et al., 2009; see also Clewett et al., 2014). (B) Schematic of analytical approach to characterize individual RSN connectome and calculate the connectome similarity for each parent-child dyad. In step 1, individual-specific time courses were estimated based on the RSN maps from Fig. 1A using spatial regression approach(Filippini et al., 2009). In step 2, the estimated individual time-courses for each RSN were then were correlated to create a functional resting-state connectome matrix. In this phase, correlation values (Pearson-r) between all possible pairs of time-courses among 13 RSNs were calculated. Finally, the connectome matrix values for each individual was Fisher-Z transformed, vectorized and correlated between each pair of parent-child dyads to calculate connectome similarity. Note that only the upper half of the connectome matrix excluding the diagonal is shown in the figure.

