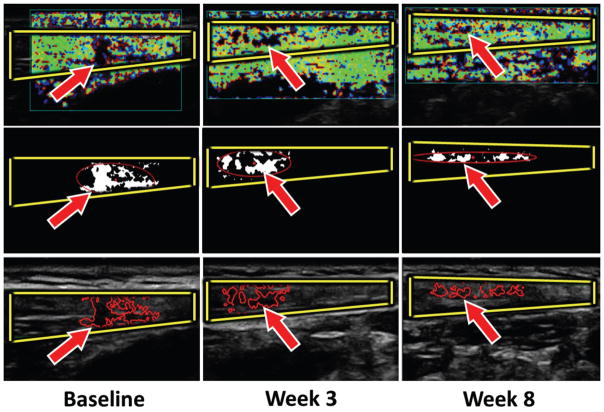
Figure 3.
Myofascial trigger point (arrows) size evolution. Top row, Color Doppler variance images. Middle row, Binary images of the mechanical heterogeneity region. Bottom row, Yellow borders indicate B-mode images of the upper trapezius muscle, and red borders indicate regions with a lower vibration amplitude (red line).

