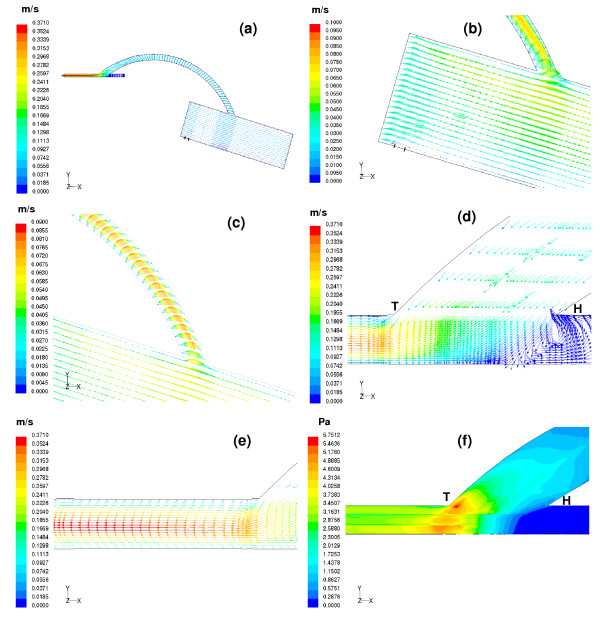
Figure 4.
(a) Velocity vectors computed at t = 0.13 sec are depicted on the centre plane of the aorto-right coronary bypass model. (b) Enlarged view of the velocity vectors inside aorta. At the start of ejection, blood from the aortic inlet flows into the ascending aorta. The blood flow at a distance of 10 mm from the entrance of the aorta behaves almost like an inviscid flow. Very little amount of flow enters the coronaries; this may be due to the high pressure in the myocardium. (c) Parabolic profiles of the velocity vectors are observed inside the graft. Slight skewing of the flow profiles is seen due to the influence of the graft curvature. (d) A close view of the recirculation region in the artery-graft junction. Major portion of the flow exiting from the graft moves towards the distal portion of the right coronary vessel. (e) The flow pattern shows slight skewing towards the floor of the artery. With increasing distance skewing disappears thus shifting the maximum velocity magnitude 0.37 m/s to the centreline of the host artery. (f) A wide variation in the wall shear stress is observed at the distal anastomotic region. The weak recirculation zone at the proximal portion of the bypassed vessel results in negligible wall shear stress with the peak wall shear stress magnitude, 5.75 Pa appearing at the floor of the artery.

