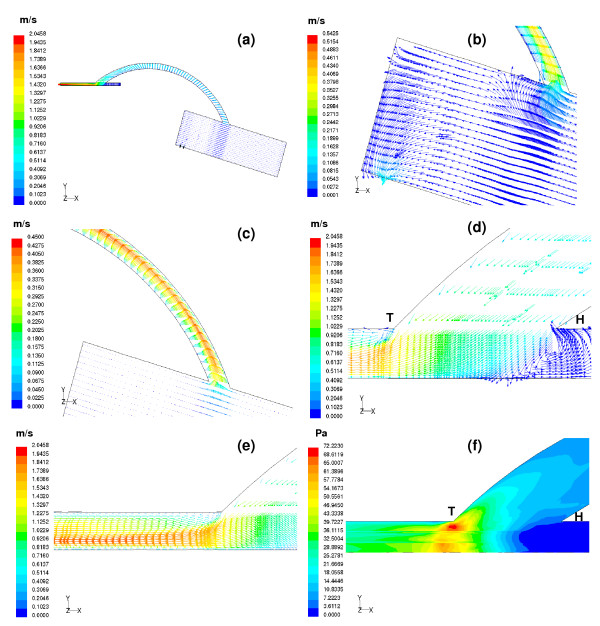
Figure 5.
(a) Velocity vectors computed at t = 0.7 sec are depicted on the centre plane of the aorto-right coronary bypass model. (b) At the mid-diastolic instant, the aortic valve is fully closed and thus back flow from the ascending aorta enters both the coronary vessels, the left coronary vessel and the bypassed right coronary vessel. (c) Parabolic profiles of the velocity vectors are seen inside the graft. Maximum perfusion of the graft occurs at mid-diastole. (d) Maximum flow velocity approaching the graft exit is around 0.95 m/s. The flow exiting the graft with a higher velocity results in a stronger impingement on the floor of the artery. The strong recirculation region seen at the proximal portion of the distal anstomotic region forces the flow to move towards the right coronary artery exit. (e) The inner wall of the host artery exhibits significant skewing of the velocity profiles. The maximum flow velocity magnitude, 2.04 m/s, seen close to the floor of the artery is shifted to the centre line of the vessel with increasing axial distance. (f) Maximum perfusion occurs at the mid-diastolic instant, t = 0.7 sec. This gives rise to maximum wall shear stress with the peak magnitude being 72.22 Pa.

