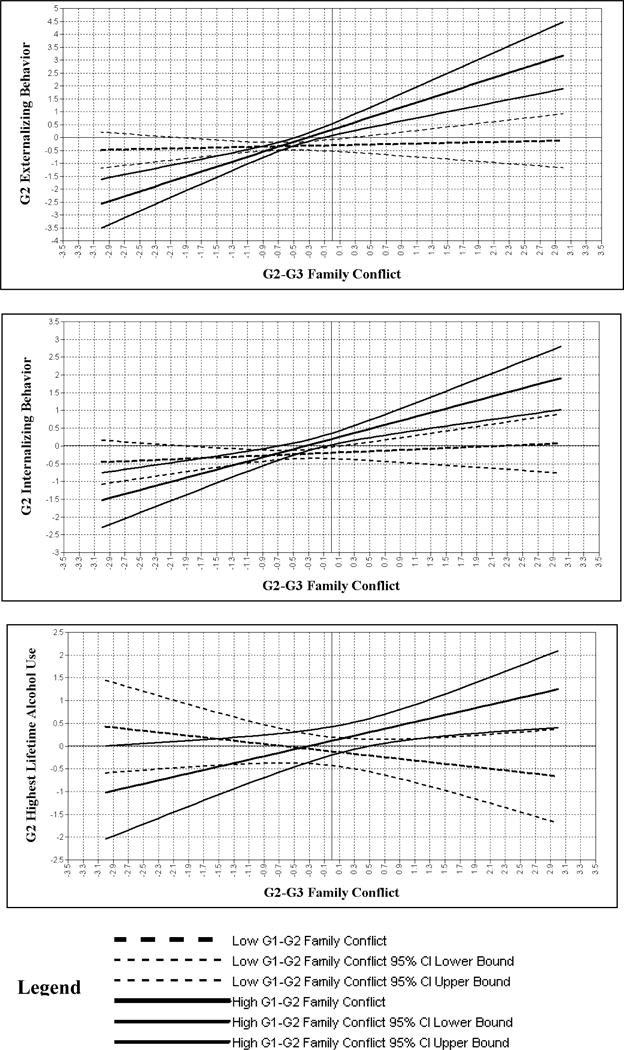
Figure 1.

Plots depicting significant interactions between G1–G2 and G2–G3 Family Conflict in predicting G2 psychopathology symptoms. Plots depict association between G2–G3 family conflict and G2 psychopathology outcome at low (−1 SD, dotted lines) and high (+1 SD, solid lines) levels of G1–G2 family conflict, with the exception of G2 Highest Lifetime Alcohol Use, where plots are at +/−2 SD. In each plot, middle dotted and solid lines depict simple slopes. Top and bottom dotted and solid lines depict 95% confidence intervals.
