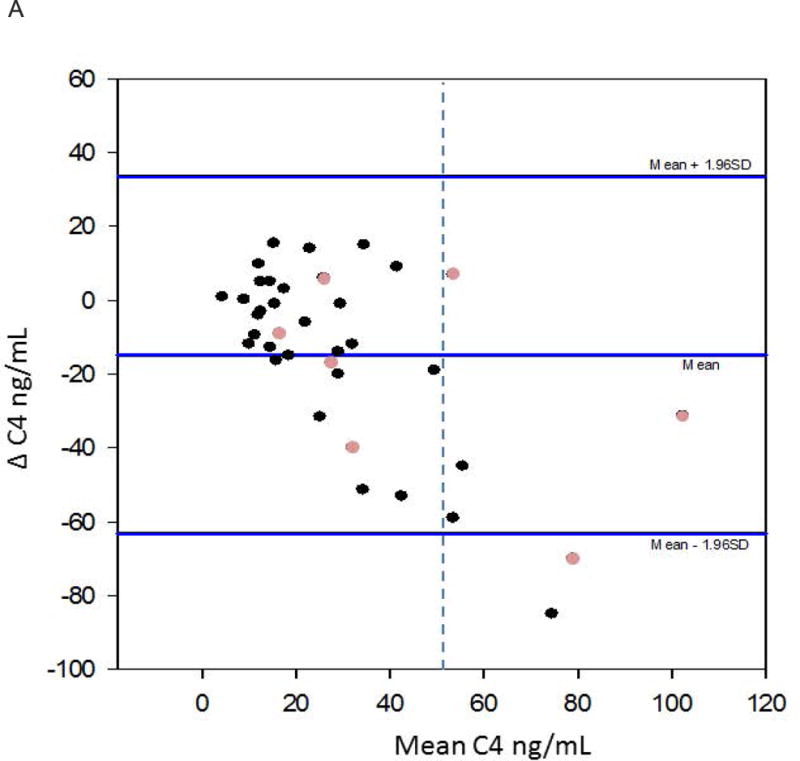
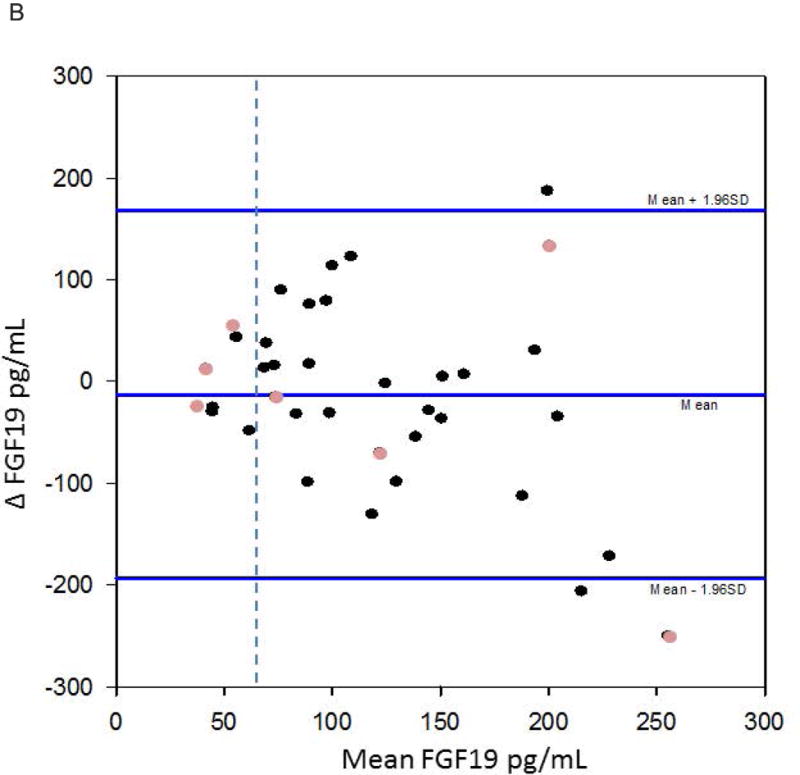
Figure 4.


a. Bland-Altman for replicate C4 values. The dashed vertical line depicts C4=52.5ng/mL. This graph depicts greater variability in the higher C4 values; of note, they are diagnostic for bile acid diarrhoea. The lighter circles represent patients who have undergone cholecystectomy.
b. Bland-Altman for replicate FGF19 values. The dashed vertical line demonstrates FGF19=61.7pg/mL. There was less variability compared to the C4 Bland-Altman plot. The lighter circles represent patients who have undergone cholecystectomy.
