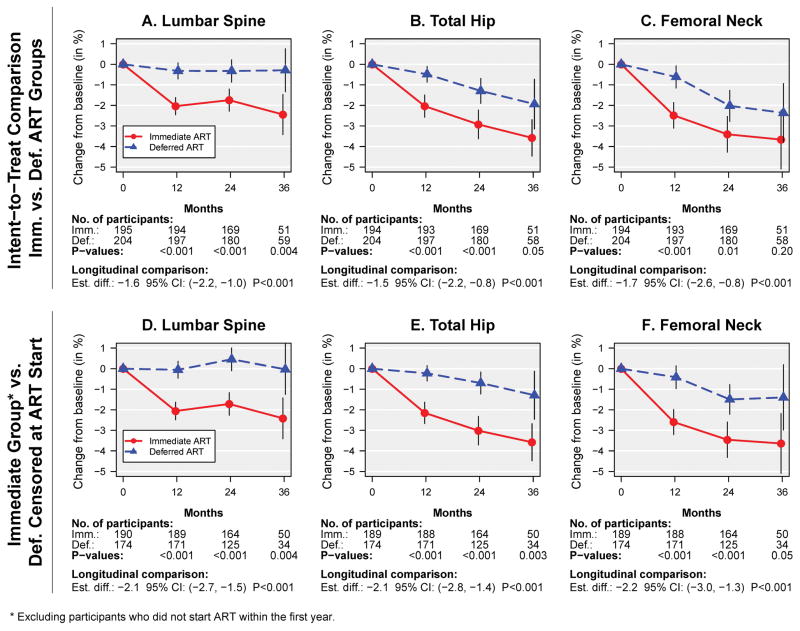
Figure 2.
Mean percent change (95% CIs) in BMD by treatment group. Panels A–C show intent-to-treat comparisons. In panels D–F follow-up in the deferred group is censored at ART start, and participants in the immediate group who did not start ART within the first year are excluded. (A and D) Lumbar spine (L1–L4) BMD, (B and E) Total hip BMD, (C and F) Femoral neck BMD.

