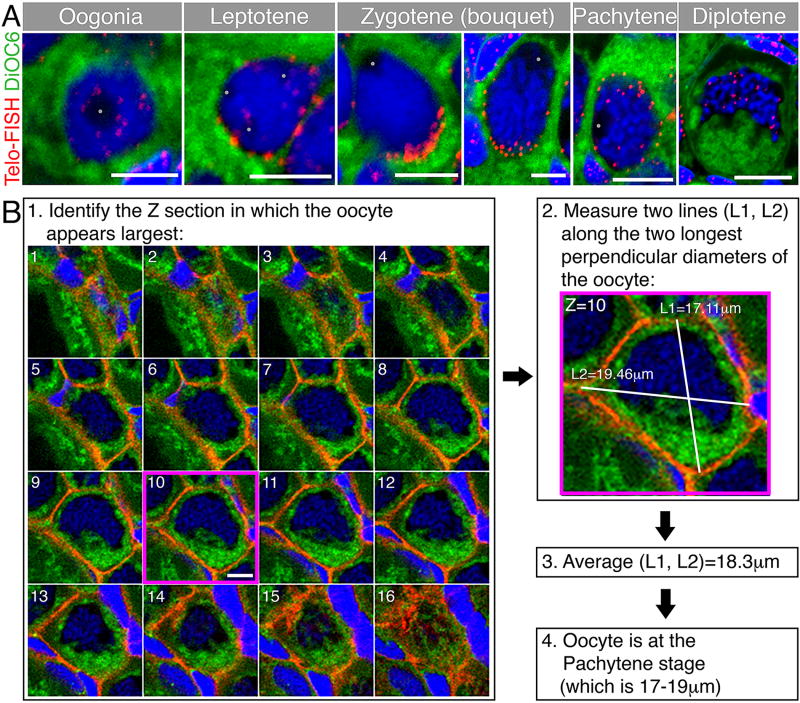
Figure 1. Representative oocytes of early stages and a method to measure oocyte size for staging.
(A) Representative early oocytes demonstrating staging criteria from Table 1, including telomere distribution as a marker of meiosis progression. Telomeres (Telo-FISH, red) are distributed in the nucleus of the oogonia, then loaded radially on the NE of the leptotene stage. At the early zygotene stage (left zgotene panel), telomeres are tightly clustered on one side of the NE. This clustering is less tight in the later zygotene stage (right zygotene panel). Telomeres redistribute radially at the pachytene stage and start to unload from the NE. At the diplotene stage telomeres are intranuclear. The general cytoplasm is detected by the DiOC6 lipid dye (green), and chromosomes are stained with DAPI (blue). Note staging criteria, such as oocyte size, DNA condensation, nucleoli (grey dots) number, and nuclear morphology across stages. Scale bars are 5 µm for oogonia-zygotene, and 10 µm for pachytene and diplotene. Modified from [14]. (B) A method to measure oocyte size in three dimensions in whole mount ovaries. For convenience, the oocyte shown is stained for cytoplasmic membranes (β-catenin, red), DiOC6 (green) and DAPI (blue). (1) Along the Z axis, find the optical section in which the oocyte appears the largest (section #10, magenta frame). Scale bar (only shown on section #10) is 10 µm. (2) In this optical section, measure the length of two perpendicular, or close to perpendicular, lines along the longest diameters of the oocyte (L1, L2). (3) The average of L1 and L2 defines the approximate diameter that indicates the size of the measured oocyte. (4) Determine what oocyte stage in Table 1 corresponds to the size of the measured oocyte, and determine stage according to size and additional staging criteria in Table 1.

