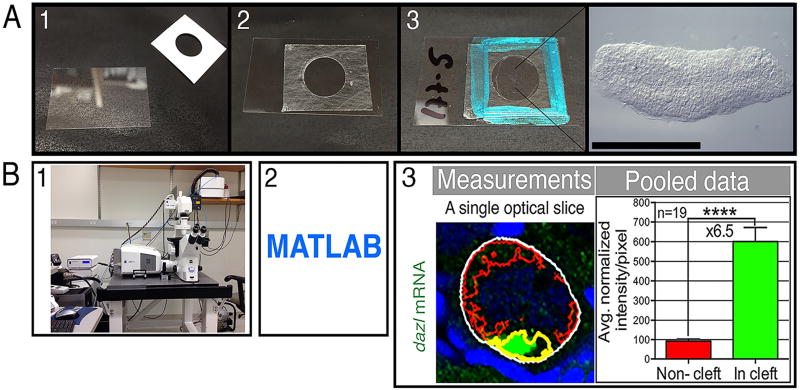
Figure 4. Mounting ovaries and quantitative imaging.
(A) Mounting set up. A microseal spacer is placed on a #1.5 24×40 mm cover slip (panels 1–2). After the ovaries are placed in vectashield with their flat side snuggly on the slip, cover with a #1.5 18×18 cover slip and seal with nail polish (panel 3). This setting allows one to image from both sides of the mounted ovaries. An example of a mounted ovary is shown (right image in panel 3), scale bar is 1 mm. (B) Quantitative imaging. After image acquisition (panel 1), custom programs in MATLAB (panel 2) are used for quantification. Panel 3 shows an example of such quantification of signal enrichment within the nuclear cleft. This example MATLAB code automatically identifies based on markers features of the oocyte, including the nucleus, the non-cleft cytoplasm (red outline) and the cleft cytoplasm (magenta outline) within the total oocyte volume (white outline) in all optical sections of the stack that spans the oocyte. It measures the intensities/area for each domain in each section. These data are then pooled for statistical analysis and results are plotted (pooled data). Images are modified from, and detailed protocol is described in Elkouby et al., 2016 [14]. The cleft cytoplasm outline here is artificially painted yellow for simplicity, the outline that is automatically generated by the program is in green and can be found in the original publication.

