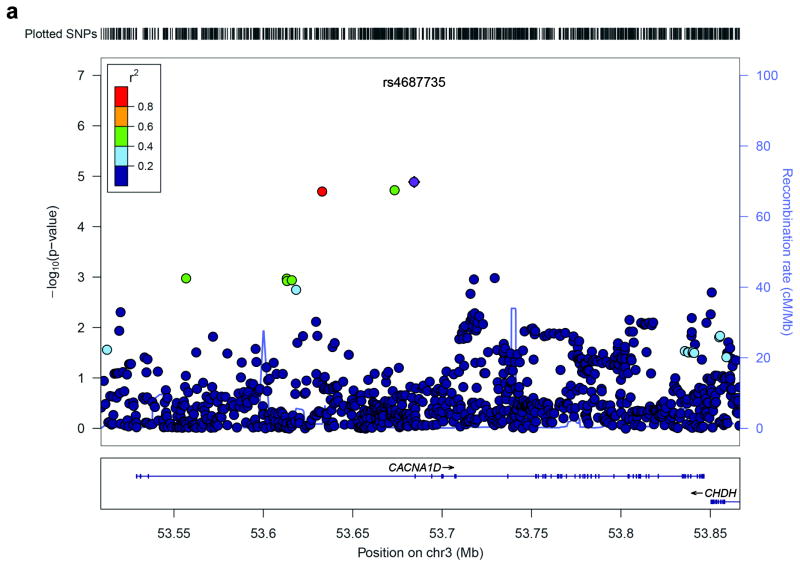
Figure 5.
Regional association plot of SNPs in and around CACNA1D. (a) SNPs are plotted with their −log10 (p-value) on the y-axis along with their physical position (NCBI build 36) on the x-axis. The SNPs are color coded according to their correlations (r2) with the most significant SNP rs4687735 shown in purple. The light blue line and right y-axis indicates the observed recombination rates in the HapMap CEU samples.

