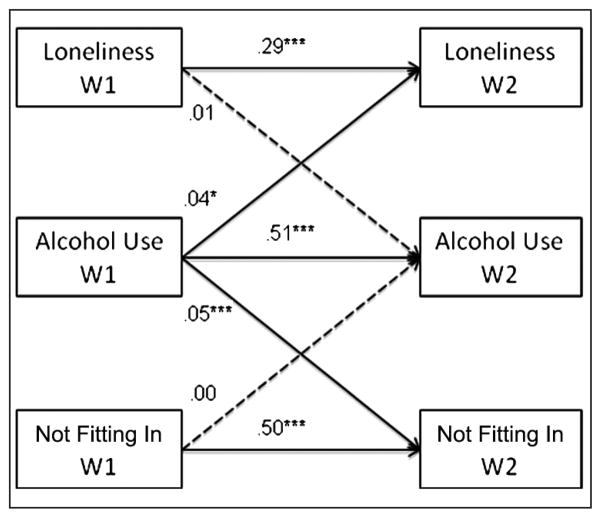
Figure 2.
Associations between Adolescent Drinking and Socioemotional Functioning over Time Note: Dashed lines denote nonsignificant paths. All models controlled for adolescent gender, age, race-ethnicity, immigrant generational status, family structure, parent education, and Picture Vocabulary Test percentile as well as school sector, size, region, and urbanicity. Comparative Fit Index = .97; root mean square error of approximation = .04.
*p < .05. **p < .01. ***p < .001.

