Figure 3.

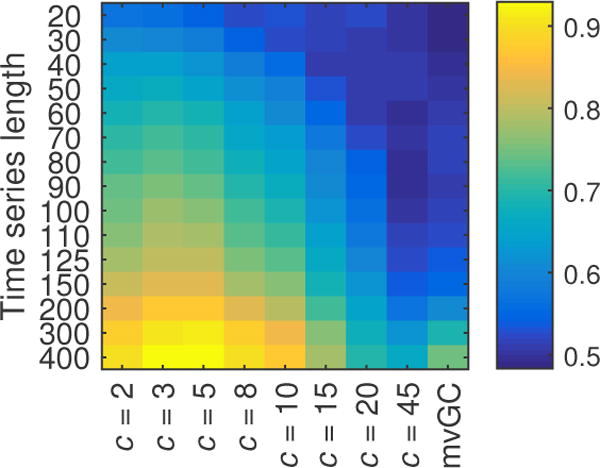
Heat map of the plot in Figure 2a. For T1.5 = 400, best results are at c = 3 and 5. However, at lower lengths, performance quality decreases with increasing number c of used principal components.

Heat map of the plot in Figure 2a. For T1.5 = 400, best results are at c = 3 and 5. However, at lower lengths, performance quality decreases with increasing number c of used principal components.