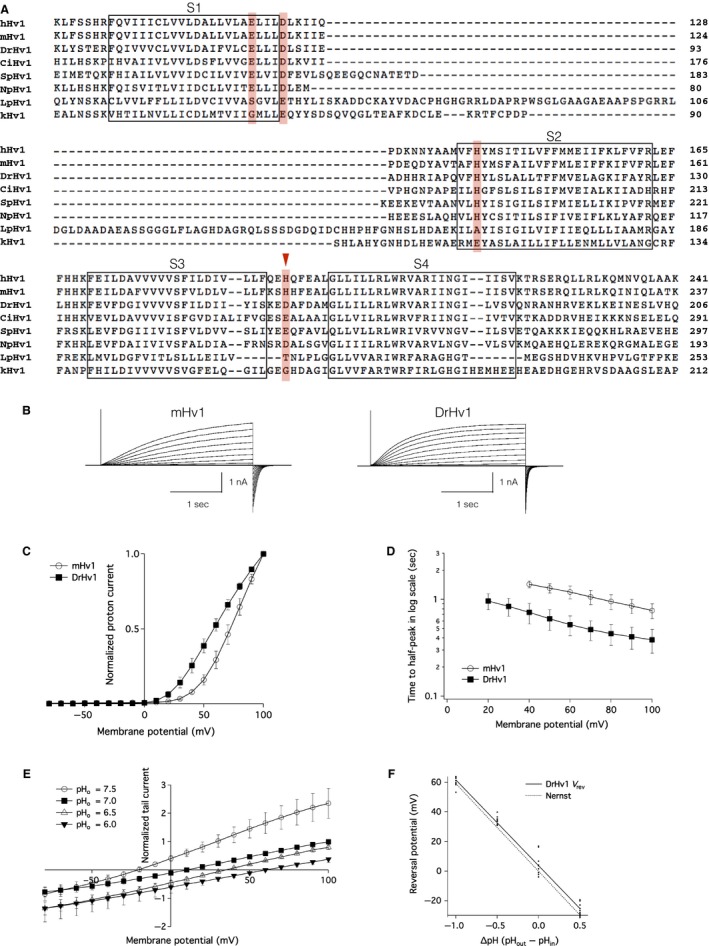
Figure 1.

Characterization of zebrafish Hv1. (A) Multiple amino acid alignment of Hv1 from human (Homo sapiens, hHv1), mouse (Mus Musculus, mHv1), zebrafish (Danio rerio, DrHv1), sea squirt (Ciona intestinalis, CiHv1), sea urchin (Strongylocentrotus purpuratus, SpHv1), insect (Nicoletia phylophila, NpHv1), and two species of dinoflagellates (Lingulodinium polyedrum, LpHv1; Karlodinium veneficum, kHv1;). Putative transmembrane helices (S1–S4) are indicated by the boxes. Zn2+‐coordinating residues are shown in red. This figure contains partial sequences focused on the main components of the Hv1 channel. Full‐length sequences can be found in Fig. S1. (B) Representative proton current traces recorded from mHv1‐ and DrHv1‐expressing HEK293T cells (left and right, respectively). The holding potential was ‐80 mV. A series of 3‐s depolarizing voltage pulses were stepped from −80 mV to 100 mV in 10‐mV increments. Both the extracellular and intracellular pHs (pH o and pH i, respectively) were 7.0. The vertical scale bar indicates the current amplitude and the horizontal scale bar indicates the duration. (C) Normalized current–voltage relationships of mHv1 (empty circles; n = 5) and DrHv1 (filled squares; n = 5). Data are presented as means ± SD. (D) T‐half values for the activation phase of mHv1 (empty circles; n = 5) and DrHv1 (filled squares; n = 5) plotted against the membrane potentials. Note that the y‐axis is calibrated in log scale. (E) Normalized current–voltage relationship recorded using a tail current protocol at pH o 7.5 (empty circles), 7.0 (filled squares), 6.5 (empty triangles) and 6.0 (filled triangles) and pH i fixed at 7.0 (n = 10). Tail currents were measured during the second depolarizing step from −80 mV to 100 mV. (F) Relationship between reversal potential (Vrev) and pH gradient across the cell membrane (ΔpH) (n = 10). Solid line is the fitting result from the averaged Vrev. The dotted line shows the predicted values from the Nernst equilibrium equation for proton conductance.
