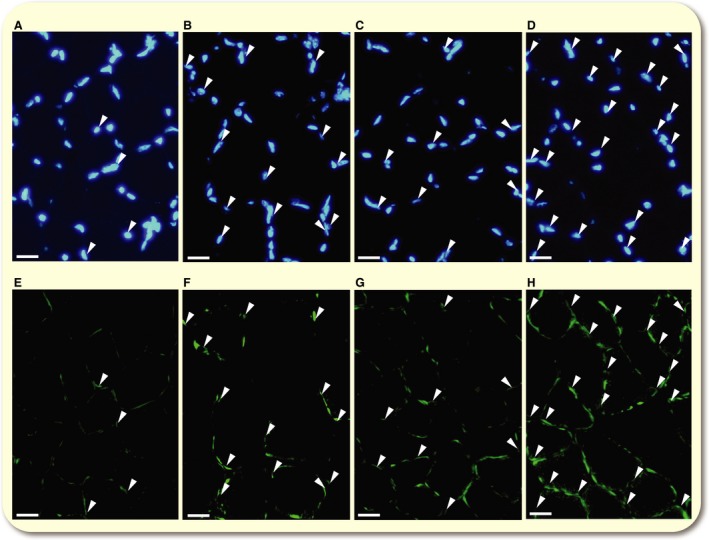
Figure 5.

Representative immunofluorescent images of the nucleus (A–D) and PGC‐1α (E‐F) in Gr in Sed (A and E), Hyp (B and F), Tr (C and G), and HypTr (D and H) groups. Arrow heads represent the colocalized area for PGC‐1 α and the nucleus. Horizontal bars represent 20 μm.
