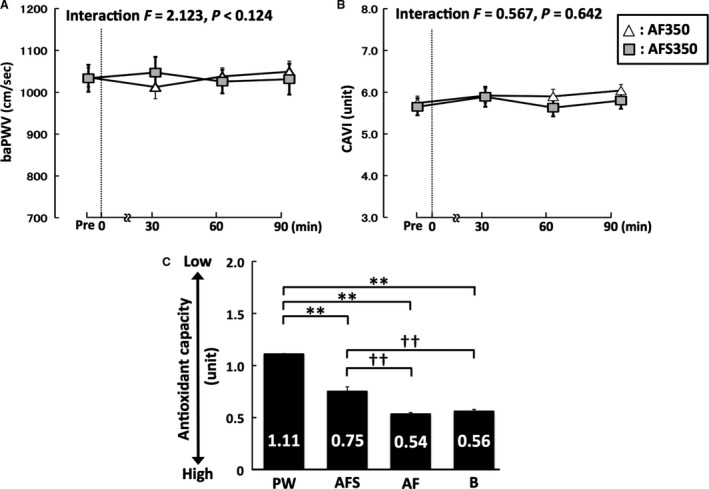
Figure 3.

Supplementary experimental data for baPWV (A), CAVI (B), and antioxidant capacity (C). Broken lines, time points of each beverage ingestion; Pre, baseline; AF, alcohol‐free beer without sugar; AFS, alcohol‐free beer with sugar; PW, pure water; B, beer; baPWV, brachial‐ankle pulse wave velocity; CAVI, cardio‐ankle vascular index; **P < 0.01 versus PW; ††P < 0.01 versus AFS. Data are expressed as mean ± SE.
