
Figure 2.
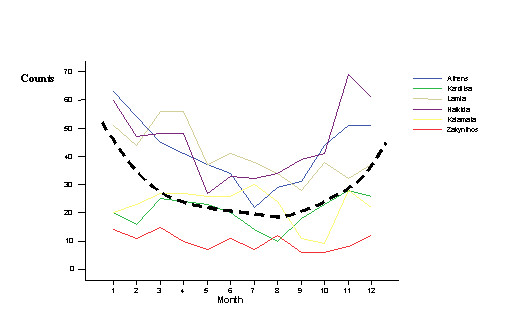
Monthly distribution of hospital admissions for ACS in the centers of the study (dotted line represents the smoothed 12 month average)
Official websites use .gov
A
.gov website belongs to an official
government organization in the United States.
Secure .gov websites use HTTPS
A lock (
) or https:// means you've safely
connected to the .gov website. Share sensitive
information only on official, secure websites.
Monthly distribution of hospital admissions for ACS in the centers of the study (dotted line represents the smoothed 12 month average)