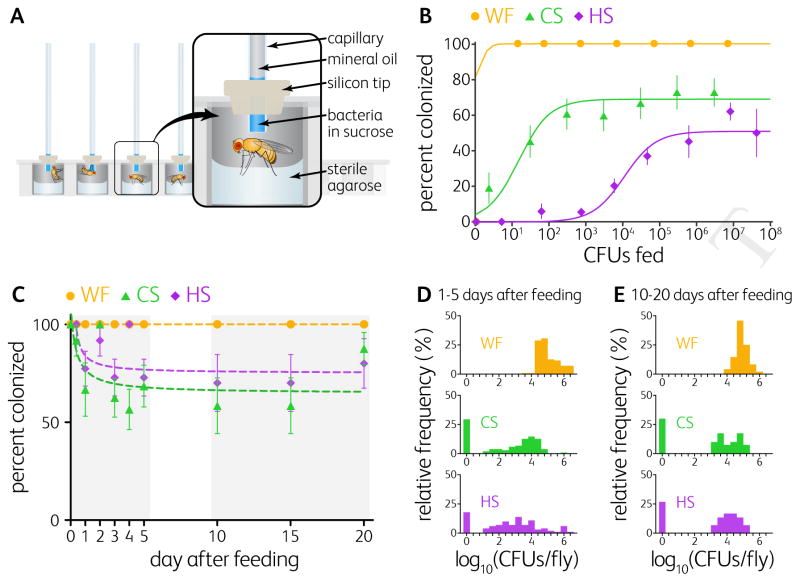
Figure 1. Colonization Is a Probabilistic Event Generating Two Stable States Over Time.
(A) Schematic of the capillary feeding microplate used to feed precise doses of bacteria to individual flies. Flies were maintained with sterile agarose for hydration.
(B) Colonization efficiencies three days after feeding germ-free Canton-S flies with Lactobacillus plantarum WF (n = 113 flies), CS (n = 238 flies), or HS (n = 521 flies). Data points represent means of groups of flies from at least three independent experiments. Solid lines are fits of the lottery model to the data (STAR METHODS). Error bars indicate S.E.P. See also Figure S1B-D.
(C) Probability that initial colonization was maintained for WF (n = 159 flies), CS (n = 142 flies), and HS (n = 131 flies). Germ-free Canton-S flies were fed once on day 0 with 1.5×10⁶, 2.5×10⁶, or 3.5×10⁶ CFUs of WF, CS, or HS respectively and individual flies were sampled over 20 days. See also Figure S1K–P.
(D–E) Frequency distributions of the bacterial loads of WF, CS, and HS in individual flies during (D) days 1 to 5 days after feeding and (E) the steady state of colonization (10 to 20 days after feeding). Mean bacterial loads in colonized flies at steady state were 1.1×10⁵, 6.1×10⁴, and 3.1×10⁴ CFUs per fly for WF, CS, and HS, respectively. Error bars indicate S.E.P. See also Figure S1K–M.

