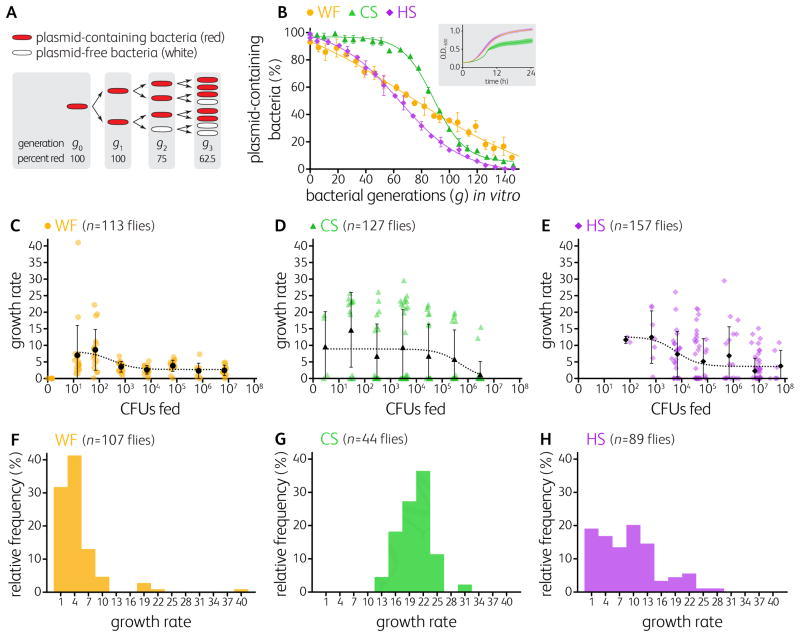
Figure 2. Bacterial growth rates in the fly gut reveal a colonization bottleneck.
(A) Plasmids lacking segregation machinery, when grown off selective medium, are lost stochastically so that the number of cell division cycles (or bacterial generations, g) can be estimated from the proportion of cells in the population that have retained the plasmid.
(B) In vitro standard curves quantifying the proportions of plasmid-containing bacteria (expressing mCherry) as a function of generations. Data points represent means of triplicates ± S.D. The ultrasensitive standard curve of CS limits our ability to detect growth until 50 generations have occurred. (B, inset) CS grows more slowly than WF and HS in vitro.
(C–E) Estimated growth rates as a function of inoculum dose of WF, CS, or HS in colonized Canton-S flies. See also Figure 1B.
(F–H) Frequency distribution of the growth rates of WF, CS, and HS in mono-colonized Canton-S flies. See also Figure S1 and Table S2.

