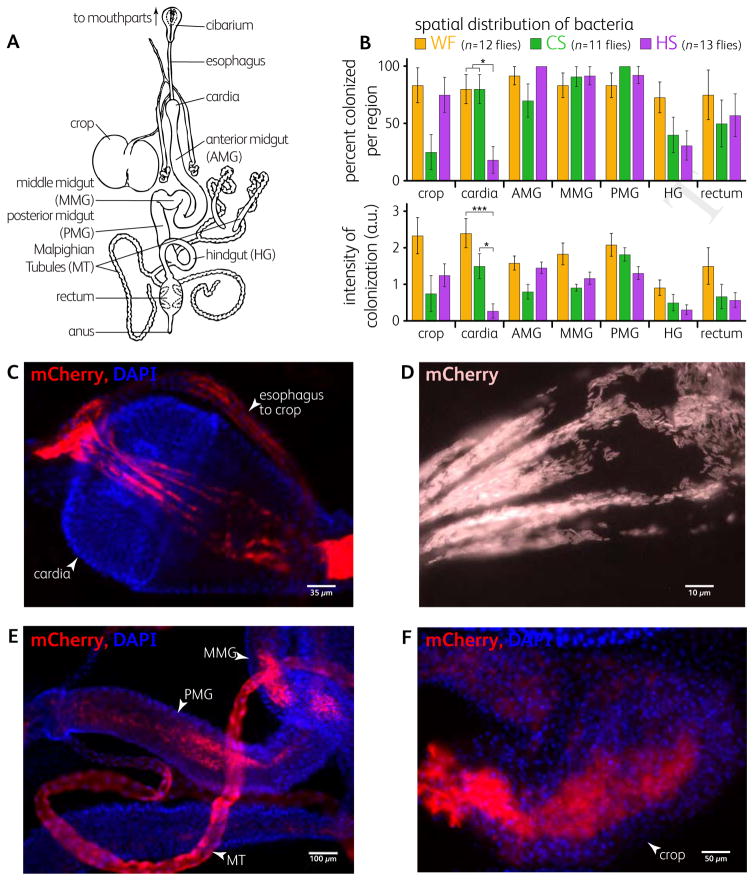
Figure 3. Microscopy Defines Spatial Colonization Differences.
(A) Representation of the digestive tract of Drosophila (after Miller [32]).
(B) Spatial colonization of gut regions of flies colonized with L. plantarum WF, CS, and HS 5 days after feeding. Positively colonized flies were dissected and gut regions were assayed for presence/absence, top bars, and relative colonization levels, bottom bars (error bars indicate S.E.P, top bars, and S.E.M., bottom bars). *p < 0.05, ***p < 0.001 by Student’s t-test (Bonferroni-corrected).
(C–F) Representative epifluorescence microscopy images of the spatial distribution of L. plantarum mCherry (red). DAPI staining (blue) indicates fly cells. (C–D) L. plantarum WF was concentrated and closely associated to the cardia as shown at 5 days after feeding. (E) L. plantarum HS was present in the lumen of the midgut one day after feeding. Malpighian tubules showed fluorescence but no individual bacterial cells suggesting accumulation of mCherry from lysed cells. (F) L. plantarum WF showed strong crop colonization 5 days after feeding. Background fluorescence due to many out of focus cells.

